housing.describe()
| longitude | latitude | housing_median_age | total_rooms | total_bedrooms | population | households | median_income | median_house_value | |
|---|---|---|---|---|---|---|---|---|---|
| count | 20640.000000 | 20640.000000 | 20640.000000 | 20640.000000 | 20433.000000 | 20640.000000 | 20640.000000 | 20640.000000 | 20640.000000 |
| mean | -119.569704 | 35.631861 | 28.639486 | 2635.763081 | 537.870553 | 1425.476744 | 499.539680 | 3.870671 | 206855.816909 |
| std | 2.003532 | 2.135952 | 12.585558 | 2181.615252 | 421.385070 | 1132.462122 | 382.329753 | 1.899822 | 115395.615874 |
| min | -124.350000 | 32.540000 | 1.000000 | 2.000000 | 1.000000 | 3.000000 | 1.000000 | 0.499900 | 14999.000000 |
| 25% | -121.800000 | 33.930000 | 18.000000 | 1447.750000 | 296.000000 | 787.000000 | 280.000000 | 2.563400 | 119600.000000 |
| 50% | -118.490000 | 34.260000 | 29.000000 | 2127.000000 | 435.000000 | 1166.000000 | 409.000000 | 3.534800 | 179700.000000 |
| 75% | -118.010000 | 37.710000 | 37.000000 | 3148.000000 | 647.000000 | 1725.000000 | 605.000000 | 4.743250 | 264725.000000 |
| max | -114.310000 | 41.950000 | 52.000000 | 39320.000000 | 6445.000000 | 35682.000000 | 6082.000000 | 15.000100 | 500001.000000 |
%matplotlib inline
import matplotlib.pyplot as plt
housing.hist(bins=50, figsize=(20,15))
save_fig("attribute_histogram_plots")
plt.show()
Saving figure attribute_histogram_plots

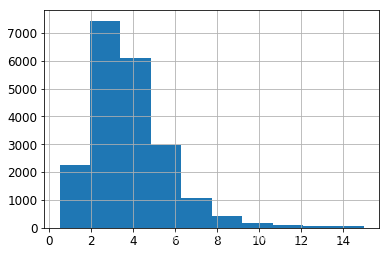
housing["median_income"].hist()

分层抽样
Warning: in the book, I did not use pd.cut(), instead I used the code below. The pd.cut() solution gives the same result (except the labels are integers instead of floats), but it is simpler to understand:
# Divide by 1.5 to limit the number of income categories
housing["income_cat"] = np.ceil(housing["median_income"] / 1.5)
# Label those above 5 as 5
housing["income_cat"].where(housing["income_cat"] < 5, 5.0, inplace=True)
housing["income_cat"] = pd.cut(housing["median_income"],
                               bins=[0., 1.5, 3.0, 4.5, 6., np.inf],
                               labels=[1, 2, 3, 4, 5])
housing["income_cat"].value_counts()
3    7236
2    6581
4    3639
5    2362
1     822
Name: income_cat, dtype: int64
housing["income_cat"].hist()

from sklearn.model_selection import StratifiedShuffleSplit

split = StratifiedShuffleSplit(n_splits=1, test_size=0.2, random_state=42)
for train_index, test_index in split.split(housing, housing["income_cat"]):
    strat_train_set = housing.loc[train_index]
    strat_test_set = housing.loc[test_index]
strat_test_set["income_cat"].value_counts() / len(strat_test_set)
3    0.350533
2    0.318798
4    0.176357
5    0.114583
1    0.039729
Name: income_cat, dtype: float64
housing["income_cat"].value_counts() / len(housing)
3    0.350581
2    0.318847
4    0.176308
5    0.114438
1    0.039826
Name: income_cat, dtype: float64
Discover and visualize the data to gain insights
housing = strat_train_set.copy()
housing.plot(kind="scatter", x="longitude", y="latitude")
save_fig("bad_visualization_plot")
Saving figure bad_visualization_plot

housing.plot(kind="scatter", x="longitude", y="latitude", alpha=0.1)
save_fig("better_visualization_plot")
Saving figure better_visualization_plot

The argument sharex=False fixes a display bug (the x-axis values and legend were not displayed). This is a temporary fix (see: https://github.com/pandas-dev/pandas/issues/10611). Thanks to Wilmer Arellano for pointing it out.
housing.plot(kind="scatter", x="longitude", y="latitude", alpha=0.4,
    s=housing["population"]/100, label="population", figsize=(10,7),
    c="median_house_value", cmap=plt.get_cmap("jet"), colorbar=True,
    sharex=False)
plt.legend()
save_fig("housing_prices_scatterplot")
Saving figure housing_prices_scatterplot

import matplotlib.image as mpimg
california_img=mpimg.imread(PROJECT_ROOT_DIR + '/images/end_to_end_project/california.png')
ax = housing.plot(kind="scatter", x="longitude", y="latitude", figsize=(10,7),
                       s=housing['population']/100, label="Population",
                       c="median_house_value", cmap=plt.get_cmap("jet"),
                       colorbar=False, alpha=0.4,
                      )
plt.imshow(california_img, extent=[-124.55, -113.80, 32.45, 42.05], alpha=0.5,
           cmap=plt.get_cmap("jet"))
plt.ylabel("Latitude", fontsize=14)
plt.xlabel("Longitude", fontsize=14)

prices = housing["median_house_value"]
tick_values = np.linspace(prices.min(), prices.max(), 11)
cbar = plt.colorbar()
cbar.ax.set_yticklabels(["$%dk"%(round(v/1000)) for v in tick_values], fontsize=14)
cbar.set_label('Median House Value', fontsize=16)

plt.legend(fontsize=16)
save_fig("california_housing_prices_plot")
plt.show()
Saving figure california_housing_prices_plot

corr_matrix = housing.corr()
corr_matrix["median_house_value"].sort_values(ascending=False)
median_house_value    1.000000
median_income         0.687160
total_rooms           0.135097
housing_median_age    0.114110
households            0.064506
total_bedrooms        0.047689
population           -0.026920
longitude            -0.047432
latitude             -0.142724
Name: median_house_value, dtype: float64
# from pandas.tools.plotting import scatter_matrix # For older versions of Pandas
from pandas.plotting import scatter_matrix

attributes = ["median_house_value", "median_income", "total_rooms",
              "housing_median_age"]
scatter_matrix(housing[attributes], figsize=(12, 8))
save_fig("scatter_matrix_plot")
Saving figure scatter_matrix_plot

housing.plot(kind="scatter", x="median_income", y="median_house_value",
             alpha=0.1)
plt.axis([0, 16, 0, 550000])
save_fig("income_vs_house_value_scatterplot")
Saving figure income_vs_house_value_scatterplot

来源:CSDN
作者:古杜且偲
链接:https://blog.csdn.net/qq_41081716/article/details/104277378