Exercise 10: Hierarchical clustering of the grain data
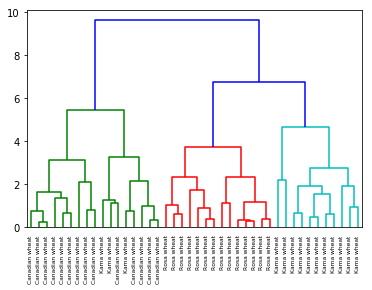
In the video, you learnt that the SciPy linkage() function performs hierarchical clustering on an array of samples. Use the linkage() function to obtain a hierarchical clustering of the grain samples, and use dendrogram() to visualize the result. A sample of the grain measurements is provided in the array samples, while the variety of each grain sample is given by the list varieties.
From the course Transition to Data Science. Buy the entire course for just $10 for many more exercises and helpful video lectures.
Step 1: Load the dataset (done for you).
import pandas as pd

seeds_df = pd.read_csv('../datasets/seeds-less-rows.csv')

# remove the grain species from the DataFrame, save for later
varieties = list(seeds_df.pop('grain_variety'))

# extract the measurements as a NumPy array
samples = seeds_df.values
Step 2: Import:
linkageanddendrogramfromscipy.cluster.hierarchy.matplotlib.pyplotasplt.
In [2]:
from scipy.cluster.hierarchy import linkage, dendrogram
import matplotlib.pyplot as plt
Step 3: Perform hierarchical clustering on samples using the linkage() function with the method='complete' keyword argument. Assign the result to mergings.
mergings = linkage(samples, method='complete')
Step 4: Plot a dendrogram using the dendrogram() function on mergings, specifying the keyword arguments labels=varieties, leaf_rotation=90, and leaf_font_size=6. Remember to call plt.show() afterwards, to display your plot.
dendrogram(mergings,
           labels=varieties,
           leaf_rotation=90,
           leaf_font_size=6,
)
plt.show()

来源:oschina
链接:https://my.oschina.net/qiyong/blog/4355750