https://zhuanlan.zhihu.com/p/106724590
2020 的开头实在是太烂了,新冠肺炎肆虐神州大地,这场突如其来的灾难影响实在是太大了,全国人民在齐心协力共度难关的同时,也无时无刻不在期盼疫情快点过去。当然我们在隔离办公的同时,每天也都关注着疫情的发展,盼望着“拐点”快点来临,毕竟大家都盼望着外面的新鲜空气呢!
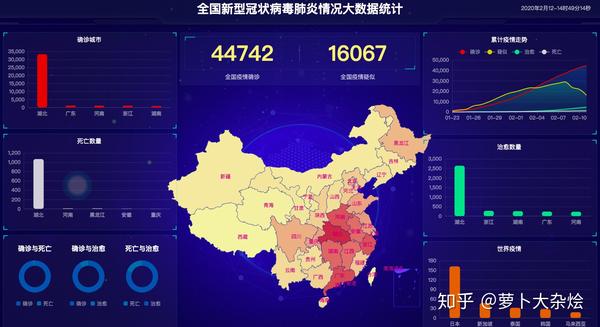
这里我制作了一个疫情展示的页面,也为这次疫情贡献一份力量。

数据获取
我这里使用的数据是天行数据提供的免费接口以及网易的实时数据接口
天行数据的两个接口
> HTTP请求GET/POST接口测试工具 - 天行数据TianAPI
和
> HTTP请求GET/POST接口测试工具 - 天行数据TianAPI
以及网易提供的实时数据接口
> https://c.m.163.com/ug/api/wuhan/app/index/feiyan-data-list
为了不多次的访问网络接口,我从这三个接口中获取到数据后,都保存到了本地的 redis 中,这样只需要每隔一段时间访问上面的三个接口即可,其余 web 页面的请求都从 redis 中获取。
以网易接口为例
def get_trend_data():
    headers = {
        'user-agent': '',
        'accept': ''
    }
    url = 'https://c.m.163.com/ug/api/wuhan/app/data/list-total'
    res = requests.get(url, headers=headers).json()
    rd.set('trend', json.dumps(res))
    return res
ECharts 画图
对于页面展示部分,主体还是采用 echarts 来展示图表。这里我们简单来看下如何在 web 页面中使用 echarts
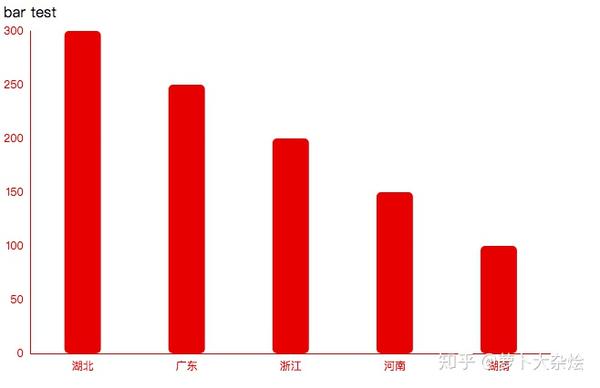
比如我们画一个简单的柱状图
首先在 HTML 文件中引入 echarts 的 js 文件
<head>
    <meta charset="UTF-8">
    <title>Title</title>
    <script type="text/javascript" src="./echarts.min.js"></script>
</head>
然后我们定义承载 echarts 图表的画布 div 标签
<div class="">bar test</div>
<div class="main" id="bar" style="height: 400px; width: 600px"></div>接下来就可以编写具体的 echarts JS 代码了
接下来就可以编写具体的 ECharts JS 代码了
var barchart = echarts.init(document.getElementById("bar"));  // 初始化 echarts 并定位到画布
        option = {
  //  backgroundColor: '#00265f',
    tooltip: {
        trigger: 'axis',
        axisPointer: {
            type: 'shadow'
        }
    },
    grid: {
        left: '0%',
		top:'10px',
        right: '0%',
        bottom: '4%',
       containLabel: true
    },
    xAxis: [{
        type: 'category',
        data: ['湖北', '广东', '浙江', '河南', '湖南'],
        axisLine: {
            show: true,
         lineStyle: {
                color: "#d5110d",
                width: 1,
                type: "solid"
            },
        },

        axisTick: {
            show: false
        },
		axisLabel:  {
                interval: 0,
               // rotate:50,
                show: true,
                splitNumber: 15,
                textStyle: {
 					color: "#d5110d",
                    fontSize: '12',
                },
            },
    }],
    yAxis: [{
        type: 'value',
        axisLabel: {
           //formatter: '{value} %'
			show:true,
			 textStyle: {
 					color: "#d5110d",
                    fontSize: '12',
                },
        },
        axisTick: {
            show: false,
        },
        axisLine: {
            show: true,
            lineStyle: {
                color: "#d5110d",
                width: 1,
                type: "solid"
            },
        },
        splitLine: {
            lineStyle: {
               color: "rgba(255,255,255,.1)",
            }
        }
    }],
    series: [
		{
        type: 'bar',
        data: [
            ('湖北', 300),
            ('广东', 250),
            ('浙江', 200),
            ('河南', 150),
            ('湖南', 100)
        ],
        barWidth:'35%', //柱子宽度
       // barGap: 1, //柱子之间间距
        itemStyle: {
            normal: {
                color:'#d5110d',
                opacity: 1,
				barBorderRadius: 5,
            }
        }
    }

	]
};
        barchart.setOption(option);
这样我们就在 web 页面上得到了一个简单的柱状图

页面构建
当然要想组合成一个完整的大屏页面,还需要更多的前端知识,而这也是最为耗费时间的。幸好网络上有很多大牛已经完成了众多模板的开发,我们只需要拿来使用即可。我这里已经下载好了完整的前端页面,下面的工作就是整理后端数据,供前端展示即可。
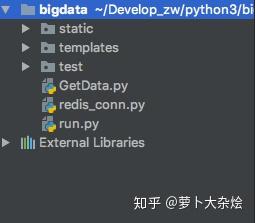
首先需要一个 web 服务器,我选择用 Flask 来搭建,先来看下项目的目录结构

run.py 文件就是 Flask 的主运行文件,由于项目较小,所以所有的逻辑代码都写在了这一个文件当中。
redis_conn.py 文件是 redis 连接池代码
GetData.py 是用于定时获取数据并保存至 redis 的代码
我们主要来看 run.py 中的代码
首先初始化 Flask 并设置根路由
from flask import Flask, render_template, jsonify
from redis_conn import redis_conn_pool
import json


app = Flask(__name__)
rd = redis_conn_pool()


@app.route('/')
def index():
    return render_template('bigdata.html')
接下来我们编写一个函数,用于返回 echart1 需要的数据
def get_chart1_data():
    chart1_data_list = []
    chart1_city_list = []
    chart1_info = {}
    city_data = json.loads(rd.get('ncovcity_data'))
    for city in city_data['newslist'][:5]:
        chart1_dict = {}
        chart1_dict['name'] = city['provinceShortName']
        chart1_dict['value'] = city['confirmedCount']
        chart1_data_list.append(chart1_dict)
        chart1_city_list.append(city['provinceShortName'])
    chart1_info['x_name'] = chart1_city_list
    chart1_info['data'] = chart1_data_list
    return chart1_info
可以看出,该函数返回一个字典,字典中的值都是一个列表
接下来编写一个供 echarts 调用的函数
@app.route('/get_chart_data')
def get_chart_data():
    chart_info = {}
    chart1_data = get_chart1_data()
    chart_info['chart1'] = chart1_data
    return jsonify(chart_info)
然后我们修改 static 中的 js.js 文件,使用 Ajax 来调用接口
$.ajax({
        url: '/get_chart_data',
        type: 'get',
        dataType: 'json',
        success: function (res) {
            echarts_1(res['chart1']);
        }
    });
这样,我们就完成了从获取数据,到前端展示的全过程。
当然,如果还需要让其他的小伙伴儿们都能看的这个页面,我们就需要把服务部署到云服务器上,我已经部署成功,大家可以访问如下地址来查看,由于是一个大屏展示的项目,所以在手机上访问可能体验不是很好。
index ncov.luobodazahui.top
来源:oschina
链接:https://my.oschina.net/u/4417917/blog/3199933