The National Health Care Anti-Fraud Association (NHCAA) estimates that healthcare fraud costs the nation approximately $68 billion annually—3% of the nation’s $2.26 trillion in healthcare spending. This is a conservative estimate; other estimates range as high as 10% of annual healthcare expenditure, or $230 billion.
Healthcare fraud inevitably results in higher premiums and out-of-pocket expenses for consumers, as well as reduced benefits or coverage.
Labeling a claim as fraudulent could require a complex and detailed investigation. This post demonstrates how to train an Amazon SageMaker model to flag anomalous post-payment Medicare inpatient claims and target them for further investigation on suspicion of fraud. The solution doesn’t need labeled data; it uses unsupervised machine learning (ML) to create a model to flag suspicious claims.
Anomaly detection is a difficult problem due to the following challenges:
- The difference between data normality and abnormality is often not clear. Anomaly detection methods could be application-specific. For example, in clinical data, a small deviation could be an outlier, but in a marketing application, you need a significant deviation to justify an outlier.
- Noise in data may appear as deviations in attribute values or missing values. Noise may hide an outlier or flag deviation as an outlier.
- Providing clear justification for an outlier may be difficult.
This solution uses Amazon SageMaker, which provides developer and data scientists with the ability to build, train, and deploy ML models. Amazon SageMaker is a fully managed service that covers the entire ML workflow to label and prepare your data, choose an algorithm, train the model, tune and optimize it for deployment, make predictions, and take action.
The end-to-end implementation of this solution is available as an Amazon SageMaker Jupyter Notebook. For more information, see the GitHub repository.
Solution overview
In this example we’re going to use Amazon SageMaker to: (1) download the dataset and visualize it using a Jupyter notebook; (2) perform data cleaning locally within the notebook and look at a sample of the data; (3) do feature engineering on text columns using the word2vec; (4) fit a principal components analysis (PCA) model to the preprocessed dataset; (5) score the entire dataset; and (6) apply a threshold to the scores to identify any suspicious or anomalous claims.
Download the dataset and visualize it using a Jupyter notebook
This post uses a Medicare inpatient claims dataset from 2008. The dataset is the publicly available Basic Stand Alone (BSA) Inpatient Public Use File (PUF) named CMS 2008 BSA Inpatient Claims PUF.
The instructions to download the dataset are available in the post’s Jupyter Notebook. For more information, see the GitHub repo.
The dataset contains a primary claim key indexing the records and six analytic variables. There are also some demographic and claim-related variables. However, because the file doesn’t provide beneficiary identities, you can’t link claims that belong to the same beneficiary. However, the dataset has sufficient information to build the model for this solution
This is a minimal dataset in terms of features. Some desired features, such as facility zip codes, are missing. You can add more data to build a set of features to continue to improve the accuracy of this solution.
You can download a copy of the dataset or access it through the GitHub repo.
The next step is to analyze the seven analytic variables, clean the data in each variable by fixing null values, and replace the ICD 9 diagnosis and procedure code with their corresponding description.
Cleaning up the column names
To clean up the columns, complete the following steps.
- Open the file
ColumnNames.csv - Strip any white spaces and double quotes
This produces the relevant names of coded columns before you start working on the dataset. See the following code example:
The table below shows the column names used to continue work on the dataset.
| Column Label | Column Name | |
| 0 | IP_CLM_ID | Encrypted PUF ID |
| 1 | BENE_SEX_IDENT_CD | Beneficiary gender code |
| 2 | BENE_AGE_CAT_CD | Beneficiary Age category code |
| 3 | IP_CLM_BASE_DRG_CD | Base DRG code |
| 4 | IP_CLM_ICD9_PRCDR_CD | ICD9 primary procedure code |
| 5 | IP_CLM_DAYS_CD | Inpatient days code |
| 6 | IP_DRG_QUINT_PMT_AVG | DRG quintile average payment amount |
| 7 | IP_DRG_QUINT_PMT_CD | DRG quintile payment amount code |
Following are characteristic features of the dataset used.
- Medicare inpatient claims from 2008
- Each record is an inpatient claim incurred by a 5% sample of Medicare beneficiaries.
- Beneficiary identities are not provided
- Zip code of facilities where patient was treated are not provided
- The file contains seven (8) variables. One primary key and 7 analytic variables
- Data dictionary required to interpret codes in dataset are provided
Visualize dataset
As evident from below screenshot, the anomalous and non-anomalous records are not obvious to mark using visual inspection. Even with statistical technique, it’s a tough problem. This is because of following challenges.
- Modeling normal objects and outlier effectively. The border between data normality and abnormality (outliers) is often not clear cut.
- Outlier detection methods are application specific. Example, in clinical data small deviation could be an outlier, but, in a marketing application large deviation is required to justify an outlier.
- Noise in data may be present as deviations in attribute values or even as missing values. Noise may hide an outlier or may flag deviation as an outlier.
- Providing justification for an outlier from understandability point of view may be difficult.
The following screenshot shows example records from the dataset:

Perform data cleaning locally within the notebook and look at a sample of the data
Generate column statistics on the dataset.
The following command identifies columns with null values:
In the results, you can see some ‘NaN’ and a mean value of 0.469985 for ICD9 primary procedure code. ‘NaN’ means “not a number”, a float value that you get if you perform a calculation whose result can’t be expressed as a number. This implies that you need to fix the null values for ICD9 primary procedure code.
Replacing ICD9 diagnosis codes
To replace null values, execute the following code and change type from float to int64. The dataset codes all procedure codes as integers.
Analyzing gender and age data
The next step is to do an imbalance analysis on gender and age. Execute following process to plot a bar graph for each gender and age field.
- Read gender/age dictionary csv file
- Join the beneficiary category code with age group/gender definition and describe the distribution amongst different age group in claims dataset
- Project gender/age distribution in the dataset on the bar graph
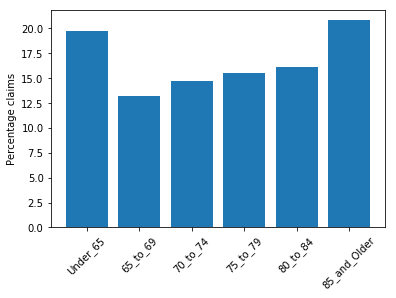
The following screenshot shows the bar plot for age group distribution. You can see a slight imbalance in the claim distribution, with Under_65 and 85_and_Older having more representation. Because these two categories represent a broader and open-ended age group, you can ignore the imbalance.
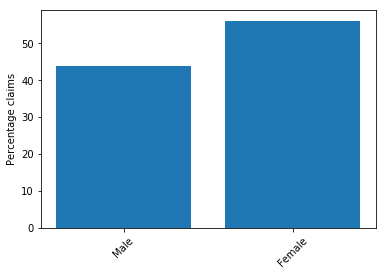
The following screenshot shows the bar plot for gender, in which there is a slight imbalance again. Claims for Female are slightly higher. However, because it is not a significant imbalance, you can ignore it.
Analyzing number of days, payment code and payment amount data
You don’t need any transformation at this stage for data on inpatients days code, DRG quintile payment code, and DRG quintile payment amount. The data is coded cleanly and any imbalanced data may have signals that the model can use to catch anomalies, so you don’t need further imbalance analysis.
Do feature engineering on text columns using the word2vec
In total, there are seven analytic variables in the dataset. Out of 7, we directly use patient age, patient gender, inpatient days, DRG quintile payment code, and DRG quintile payment amount as features without any further transformation. No feature engineering is required on these fields. These fields are coded as integers and mathematical operations can be safely applied.
However, you still need to extract relevant features from the diagnosis and procedure description. The diagnosis and procedure fields are coded as integers but result of mathematical operations on coded values will distort the meaning. Example, the average of two procedure codes or diagnosis codes may result in a code that is code for some third procedure/diagnosis that is no way equivalent or close to two procedure/diagnosis codes used to calculate an average. This post discusses the technique to code procedure and diagnosis description fields in the dataset in a more meaningful way. The technique uses Continuous Bag of Words (CBOW), which is a specific word2vec implementation for a technique referred to as word embedding.
Word embedding converts words into numbers. There are many ways to convert text into numbers, such as frequency counts and one hot encoding. Most of the traditional methods generate a sparse matrix and are less effective contextually and computationally.
Word2vec is a shallow neural network that maps words to target variables that are also words. During the training, the neural network learns weights that act as word vector representations.
This CBOW model predicts a word in a given context, which can be something like a sentence. The dense vector representations of words learned by word2vec carry semantic meanings.
Text pre-processing on diagnosis and procedure descriptions
The following code performs text processing on diagnosis descriptions to make some of the acronyms more meaningful for word embeddings.
- Change to lowercase
- Replace
- ‘&’ with ‘and’,
- ‘non-‘ with ‘non’
- ‘w/o’ with’without’
- ‘ w ‘with’ with
- ‘ maj ‘with ‘ major ‘
- ‘ proc ‘with ‘ procedure ‘
- ‘o.r.’with ‘operating room’
- Split phrase into words
- Return vector of words
After tokenizing and pre-processing diagnosis descriptions, feed the output into word2vec to generate word embeddings.
Generating word embeddings for individual words
To generate word embeddings for individual words in the preprocessed procedure and diagnosis description, complete the following steps:
- Train a word2vec model to convert the pre-processed procedure and diagnosis description into features and use a Python visualization library called
snsto visualize the results in 2D space. - Extract feature vectors from pre-processed diagnosis and procedure code description using CBOW.
- Train a word2vec model locally on the Amazon SageMaker Jupyter Notebook instance for diagnosis and procedure description.
- Use the model to extract fixed-length word vectors for each word in the procedure and diagnosis description.
This post uses the word2vec available as a part of the gensim package. For more information, see genism 3.0.0 on the Python Package Index website. The final output of above steps is a vector of 72 floating point numbers for each word. This is used as a feature vector for tokenized words in diagnosis and procedure description.
Generating word embeddings from procedure and diagnosis description phrases
After you have the word vectors for each word, you can generate new word embeddings.
- Use the mean of all the word vectors in the procedure and diagnosis description to build a new vector for each complete phrase that describes diagnosis and procedure.
The new vector becomes your feature set for diagnosis and procedure description fields in the dataset. See the following code example:
- Take the average of all word vectors in a phrase.
This generates the word embeddings for full diagnosis description phrase. See the following code example:
- Expand the diagnosis description vectors into features. See the following code example:
The following screenshot shows the generated word embeddings. However, they are abstract and don’t help with visualization.

- Repeat the preceding process for diagnosis code for procedure codes.
You end up with a feature set for procedure descriptions. See the following screenshot.

Visualizing diagnosis and procedure description vectors
This post uses a technique called t-SNE to visualize results of word embeddings—multi-dimensional space—in 2D or 3D. The following screenshot shows a t-SNE graph that plots the 2D projection of word vectors that the word2vec algorithm generated.
The word2vec and t-SNE graph may not always look the same even if the parameters used to train the model are same. This is because of random initialization at the beginning of every new training session.
There is no ideal shape in which the t-SNE graph should appear. However, avoid using a pattern in which all the words appear in one single cluster very close to each other. The below graph has a good spread.
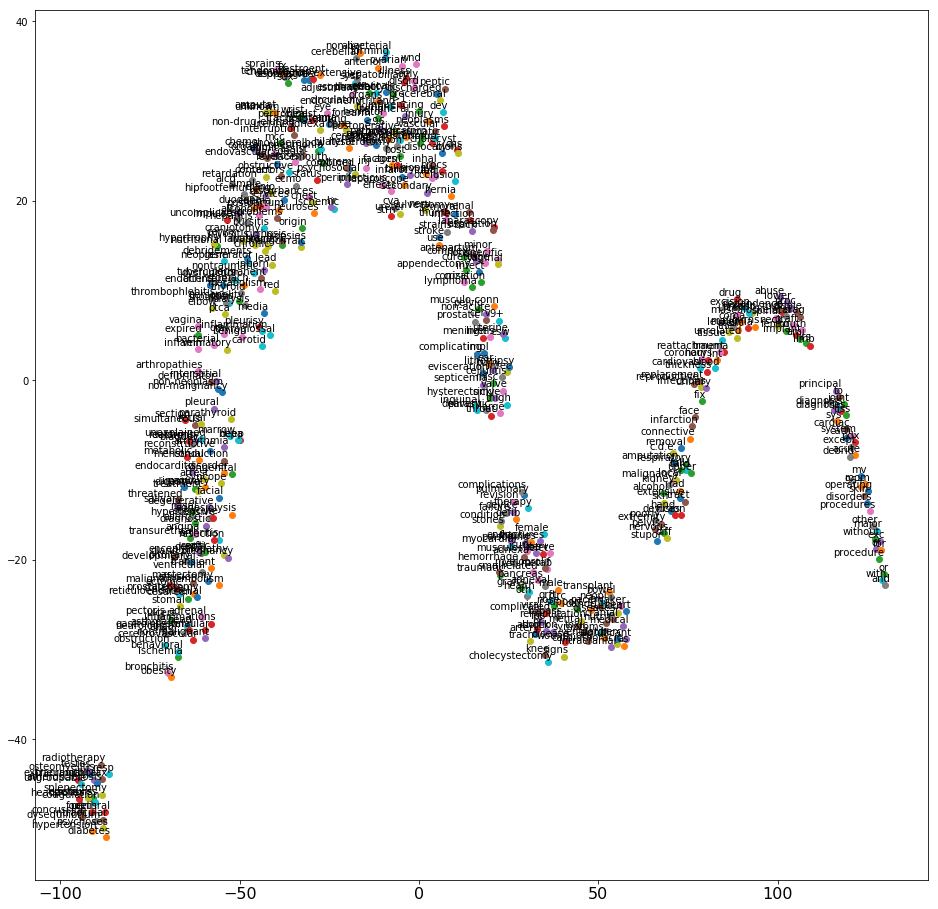
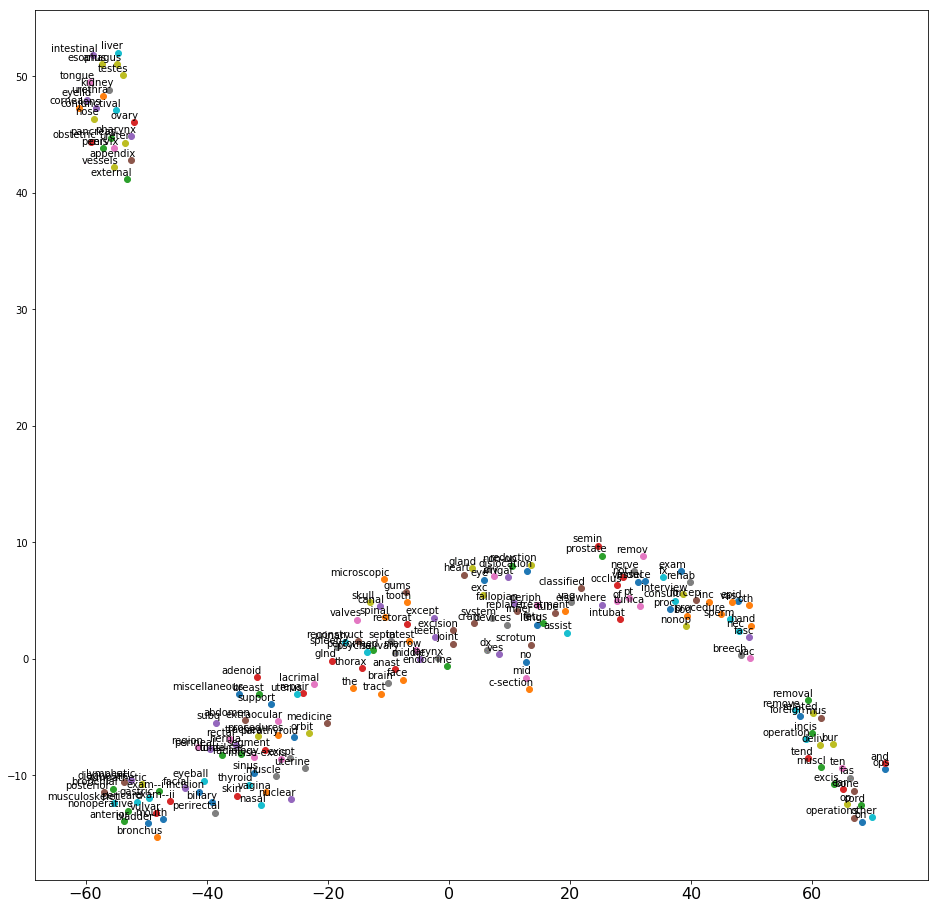
Repeat the preceding process for procedure descriptions. The following screenshot shows the 2D projection after processing and applying word2vec. Again, the graph has a good spread.
Aggregating all feature sets and composing the final feature set for training
Your next step is to aggregate all the features extracted from the six analytic variables and compose a final feature set. You can use standard Python libraries for data science.
Fit a principal component analysis (PCA) model to the preprocessed dataset
The next step demonstrates how to use PCA to do anomaly detection. I use a technique described in A Novel Anomaly Detection Scheme Based on Principal Component Classifier to demonstrate PCA-based anomaly detection method.
Splitting the data into train and test
Before applying PCA to do anomaly detection, you need to split the data into train and test. Make sure that this random split has samples that cover the distribution of payments of all sizes. This post performs a stratified shuffle split on the DRG quintile payment amount code, taking 30% of the data for testing and 70% for training. See the following code example:
The next step is to standardize the data to avoid dominance by high-scale variables.
Standardizing data based on the training sample
Because the PCA algorithm that you use later for training maximizes the orthogonal variances in the data, standardize the training data to have zero-mean and unit-variance before performing PCA. By doing this, you make sure that the PCA algorithm is idempotent to such rescaling, and prevent large-scale variables from dominating the PCA projection. See the following code example:
You now have your features from the dataset extracted and standardized. You can use Amazon SageMaker PCA to do an anomaly detection. I use Amazon SageMaker PCA to reduce the number of variables and to make sure that your variables are independent of one another.
Amazon SageMaker PCA is an unsupervised ML algorithm that reduces the dimensionality (number of features) within a dataset while still retaining as much information as possible. It does this by finding a new set of features called components, which are composites of the original features that are uncorrelated with one another. They are also constrained so that the first component accounts for the largest possible variability in the data, the second component accounts for the second most variability, and so on.
The output model trained on data using Amazon SageMaker PCA calculates how each variable is associated with one another (covariance matrix), the directions in which data disperses (eigenvectors), and the relative importance of these different directions (eigenvalues).
Converting data into a binary stream and uploading to Amazon S3
Before launching the Amazon SageMaker training job, convert the data into a binary stream and upload to Amazon S3. See the following code example:
Calling an Amazon SageMaker fit function to start the training job
The next step is to call an Amazon SageMaker fit function to start the training job. See the following code example:
The pca.fit function call triggers the creation of separate training instances. This allows you to choose different instance types for training and for building and testing.
Score the entire dataset
Downloading and unpacking trained PCA model
When the training job is complete, Amazon SageMaker writes the model artifact to the specified S3 output location. You can download and unpack the returned PCA model artifact for dimensionality reduction.
The Amazon SageMaker PCA artifact contains 𝑉, the eigenvector principal components, in increasing order of 𝑠, their singular values. A component’s singular value is equal to the standard deviation that the component explains. For example, the squared value of a singular component is equal to the variance that the component explains. Therefore, to calculate the proportion of variance of the data that each component explains, take the square of the singular value and divide it by the sum of all the singular values squared.
To make the components that explain the most variance appear first, reverse this returned ordering.
Plotting PCA components to reduce dimensionality further
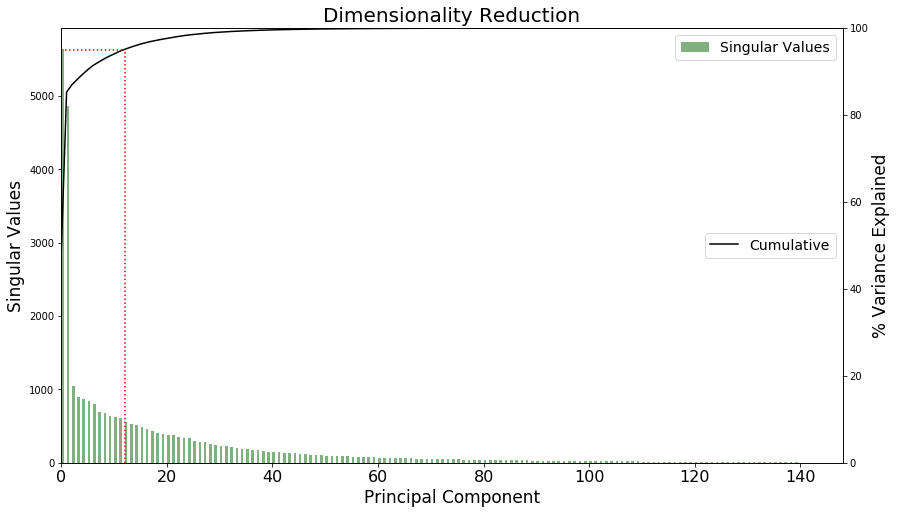
You can use PCA to reduce the dimensionality of the problem. You have 𝑃 features and 𝑃−1 components, but you can see in the following graph that many of the components don’t contribute much to the explained variance of the data. Keep only the 𝐾 leading components, which explain 95% of the variance in your data.
Thirteen components explain 95.08% of the data’s variance. The red dotted line in the following graph highlights the cutoff required for 95% of the data’s variance.
Calculating the Mahalanobis distance to score anomaly for each claim
This post uses the Mahalanobis distance of each point as its anomaly score. Take the top 𝛼% of these points to consider as outliers, where 𝛼 depends on how sensitive you want your detection to be. This post takes the top 1%, 𝛼=0.01. Therefore, calculate the (1−𝛼)-quantile of Distribution 𝐷 as the threshold for considering a data point anomalous.
The following graph was generated based on the Mahalanobis distance derived from the feature set that is the output of the Amazon SageMaker PCA algorithm. The red line describes the threshold for anomaly detection based on sensitivity defined by 𝛼.
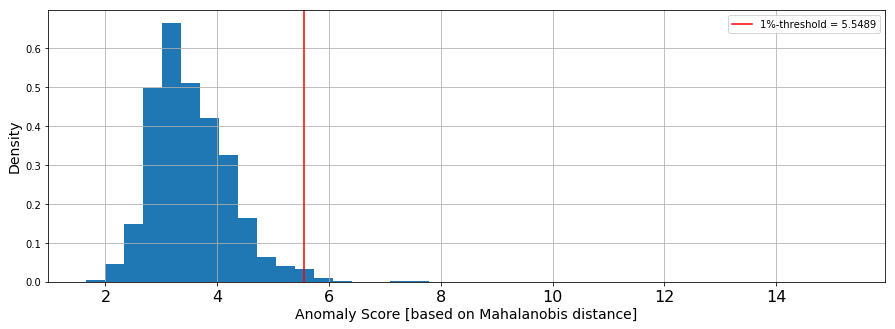
Using the anomaly score derived from the Mahalanobis distance and the sensitivity, you can label the claim as “is anomaly” TRUE/FALSE. Records with “anomalous” TRUE clear the threshold for anomaly and should be considered suspicious. “anomalous” FALSE records don’t clear the threshold and are not considered suspicious. This separates anomalous claims from standard claims.
Apply a threshold to the scores to identify any suspicious or anomalous claims
Plotting and analyzing anomalous records
Using the sequence of actions you performed on the CMS claims dataset, you can tag anomalous claim records based on purely mathematical techniques and without unlabeled data.
The following screenshot shows example standard records.

The following screenshot shows example anomalous records.
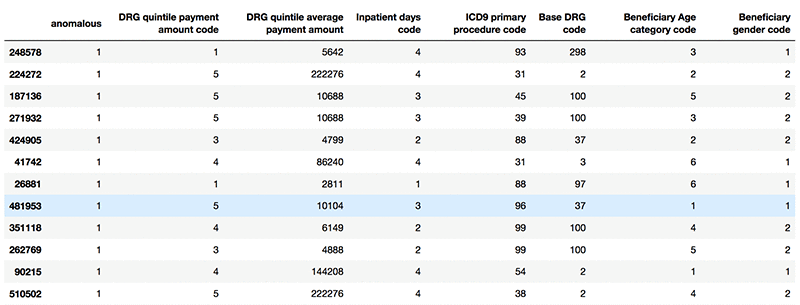
Now that you have separated standard data from anomalous data, you can consider any data points marked TRUE for “anomalous” as suspicious and pass them on for further investigation.
Expert investigation can confirm if the claim is truly anomalous or not. If you are curious and would like come up with your own explanation, hypothesis, or pattern, you could do a pair plot between different variables such as age, gender, inpatient days, quintile code, quintile payment, procedure, and diagnosis code.
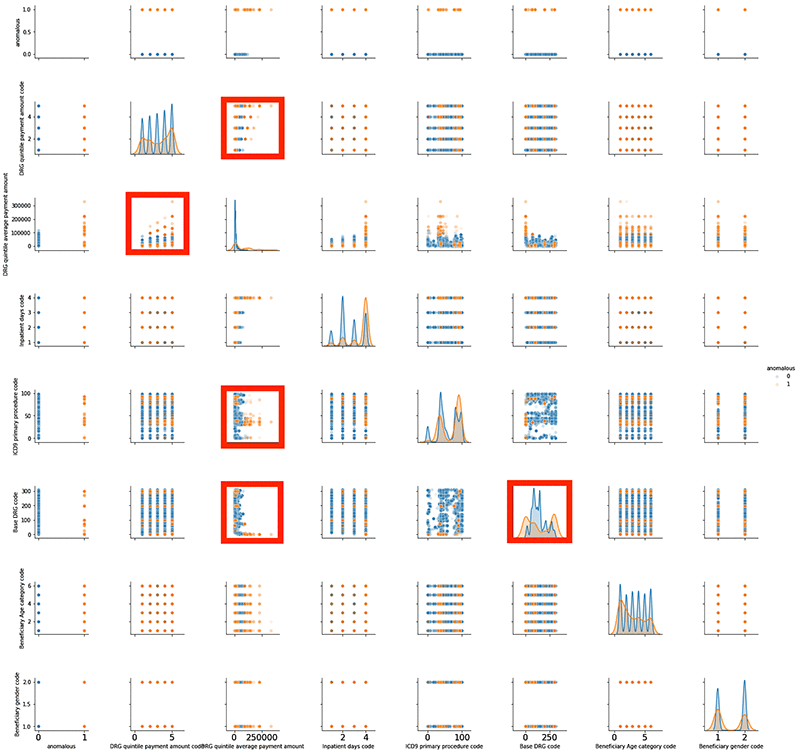
For basic analysis, you can use the seaborn library to do a pair plot. The following screenshot shows a pair plot for both standard (blue) and anomalous claims (orange) in a single graph superimposed on one another. You can identify orange points that are either asymmetric with blue points or are sitting in isolation with no nearby blue points.
The pair plots highlighted in red show asymmetric patterns. Between blue and orange are some isolated areas where orange dots exist but blue dots do not. You can dig deeper into these plots and analyze the data behind highlighted plots to find a pattern or come up with a hypothesis. Because this post doesn’t provide labeled data, it is difficult to test a hypothesis. However, with time, you may have more labeled data with which to test your hypothesis and improve the model’s accuracy.
Conclusion
This post demonstrated how to build a model to flag suspicious claims. You can use the model as a starting point to build a process to support payment integrity. You can further extend the model by bringing in more data from existing sources or adding more data sources. The model in this post scales and can absorb more data to improve results and performance.
Using this model may help minimize cases of fraud. Fear of being flagged could discourage falsified claims and bring down the cost of healthcare premiums for subscribers. If you would like try out this technique described here using your own Amazon SageMaker Jupyter Notebook. The instructions and artifacts are available in the GitHub repository.
About the Authors
Vikrant Kahlir, Strategic Solutions Architect, AWS Solution Architecture
Elena Ehrlich, Senior Data Scientist, AWS Professional Services
Hanif Mahboobi, Senior Data Scientist, AWS Professional Services
来源:oschina
链接:https://my.oschina.net/u/4261184/blog/3201292