问题
Example code:
rsq <- round(cor(mtcars$disp, mtcars$mpg)^2, 2) # rsq = 0.72

ggplot(mtcars, aes(x = disp, y = mpg)) +
  geom_point() +
  geom_smooth(method = lm, aes(color = "Linear")) +
  scale_color_discrete(labels = expression(paste("R"^2, " = ", rsq)))
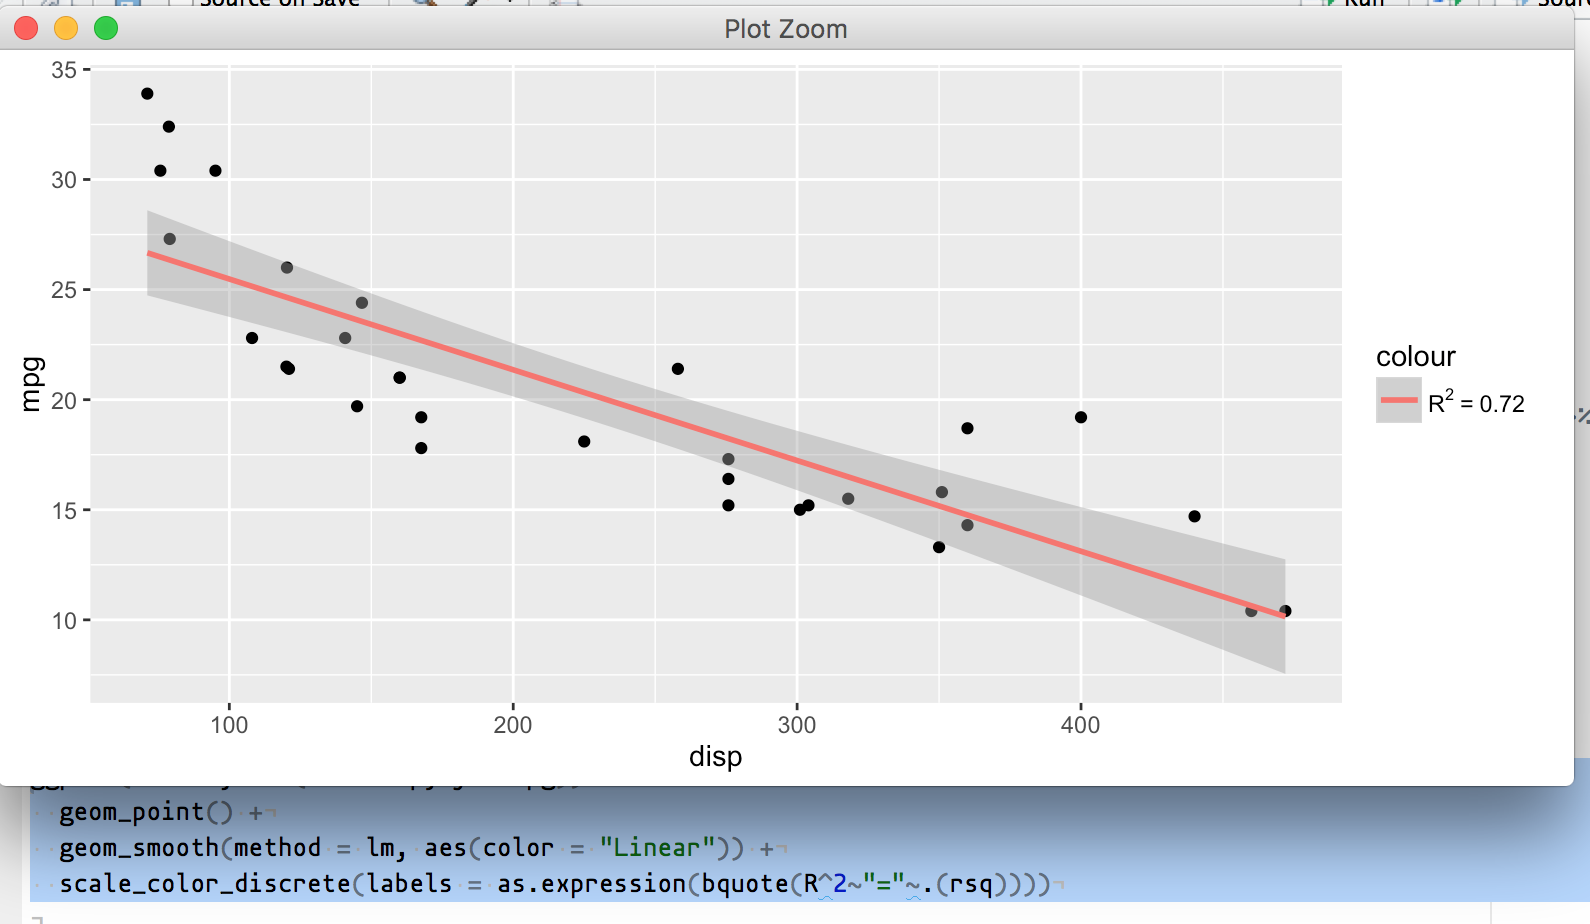
I would like the legend to be displayed as R² = 0.72.
I know I can just use the unicode symbol for ² to get the superscript, but in general I think there has to be a way to combine math expressions and calculated values stored in objects.
I have tried to play around with eval and various combinations of paste, but it seems I keep running into the same problem.
Edit #1:
I tried using bquote according to this answer like this:
scale_color_discrete(labels = bquote(R^2 == .(rsq)))
Turns out that only renders the legend as ==.
Edit #2:
Even though the answer below works, it seems… very inconvenient for more complex expressions, like this:

I'm still hoping for a simpler solution.
回答1:
Turns out the bquote thing was close.
This works (although it feels… suboptimal):
scale_color_discrete(labels = as.expression(bquote(R^2~"="~.(rsq))))
Also working:
scale_color_discrete(labels = as.expression(bquote(R^2 == .(rsq))))
Apparently the ~ are required to "paste" the elements together, without actually paste()ing them? And as.expression does what expression couldn't. I'm not sure what exactly is going on, but alas, it works:

Thanks a lot, Peter Dalgaard!
回答2:
I noticed that, as of version 3.3.2 of the ggplot2 package, both scale_color_discrete() and scale_color_manual() now accept bquote() labels directly. Presumably this change applies more broadly to other scale_ functions but I haven't tested more widely.
Simpler approaches like geom_line(aes(color = bquote(...))) and geom_line(aes(color = as.expression(bquote(...)))) are still rejected as having invalid aesthetics, though.
data = data.frame(x = seq(0, 5, length.out = 50))
data$exp1 = 1 - exp(-data$x)
data$exp0.5 = 1 - exp(-0.5 * data$x)
ggplot(data, aes(x = x)) + geom_line(aes(y = exp1, color = "exp1")) +
  geom_line(aes(y = exp0.5, color = "exp0.5")) +
  scale_color_manual(labels = c(bquote(1 - e^-x), bquote(1 - e^"-0.5x")), values = c("blue", "green")) + # or scale_color_discrete(labels = c(bquote(1 - e^-x), bquote(1 - e^"-0.5x")))
  labs(y = "y") + theme(legend.position = c(0.8, 0.15))
来源:https://stackoverflow.com/questions/35957129/r-ggplot2-evaluate-object-inside-expression