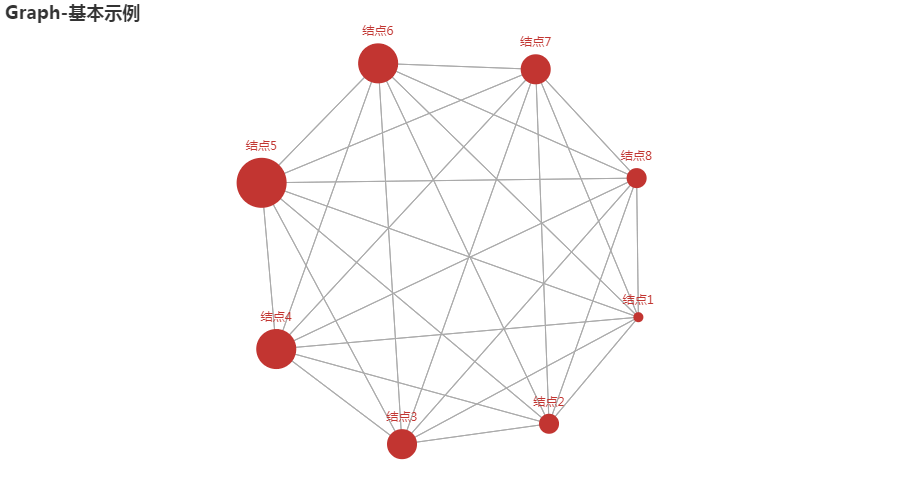
from pyecharts import options as opts
from pyecharts.charts import Graph, Page


nodes = [
        {"name": "结点1", "symbolSize": 10},
        {"name": "结点2", "symbolSize": 20},
        {"name": "结点3", "symbolSize": 30},
        {"name": "结点4", "symbolSize": 40},
        {"name": "结点5", "symbolSize": 50},
        {"name": "结点6", "symbolSize": 40},
        {"name": "结点7", "symbolSize": 30},
        {"name": "结点8", "symbolSize": 20},
]
links = []
for i in nodes:
    for j in nodes:
        links.append({"source": i.get("name"), "target": j.get("name")})
c = (
        Graph()
        .add("", nodes, links,repulsion=8000,layout='circular')#layout='force'或'circular'
        .set_global_opts(title_opts=opts.TitleOpts(title="Graph-基本示例"),)
)
c.render_notebook()
在jupyter notebook中会自动翻转的关系图:
from pyecharts import options as opts
from pyecharts.charts import Graph, Page
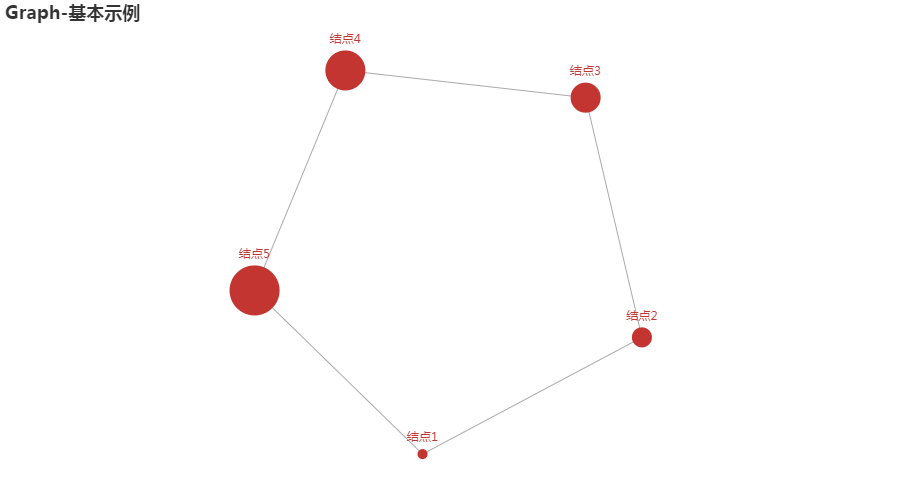
nodes = [
        opts.GraphNode(name="结点1", symbol_size=10),
        opts.GraphNode(name="结点2", symbol_size=20),
        opts.GraphNode(name="结点3", symbol_size=30),
        opts.GraphNode(name="结点4", symbol_size=40),
        opts.GraphNode(name="结点5", symbol_size=50),
    ]
links = [
        opts.GraphLink(source="结点1", target="结点2"),
        opts.GraphLink(source="结点2", target="结点3"),
        opts.GraphLink(source="结点3", target="结点4"),
        opts.GraphLink(source="结点4", target="结点5"),
        opts.GraphLink(source="结点5", target="结点1"),
]
c = (
        Graph()
        .add("", nodes, links, repulsion=8000)
        .set_global_opts(title_opts=opts.TitleOpts(title="Graph-基本示例"))
)
c.render_notebook()
from pyecharts import options as opts
from pyecharts.charts import Graph, Page


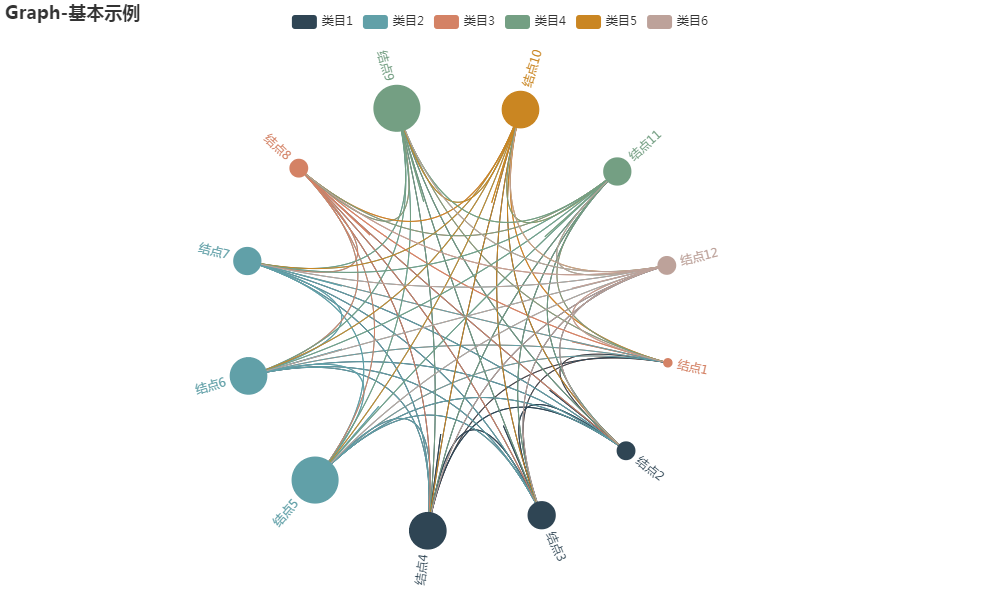
categories=[{}, {'name': '类目1'},{'name': '类目2'},{'name': '类目3'},{'name': '类目4'},{'name': '类目5'},{'name': '类目6'}]
nodes = [
        {"name": "结点1", "symbolSize": 10,"category":3},#categories[3]='类目3'
        {"name": "结点2", "symbolSize": 20,"category":1},
        {"name": "结点3", "symbolSize": 30,"category":1},
        {"name": "结点4", "symbolSize": 40,"category":1},
        {"name": "结点5", "symbolSize": 50,"category":2},
        {"name": "结点6", "symbolSize": 40,"category":2},
        {"name": "结点7", "symbolSize": 30,"category":2},
        {"name": "结点8", "symbolSize": 20,"category":3},
        {"name": "结点9", "symbolSize": 50,"category":4},
        {"name": "结点10", "symbolSize": 40,"category":5},
        {"name": "结点11", "symbolSize": 30,"category":4},
        {"name": "结点12", "symbolSize": 20,"category":6}
]
links = []
for i in nodes:
    for j in nodes:
        links.append({"source": i.get("name"), "target": j.get("name")})
c = (
        Graph(init_opts=opts.InitOpts(width="1000px", height="600px"))
        .add("", nodes, links, categories=categories,repulsion=8000,
            layout="circular",
            is_rotate_label=True,
            linestyle_opts=opts.LineStyleOpts(color="source", curve=0.3),
            label_opts=opts.LabelOpts(position="right"))
        .set_global_opts(title_opts=opts.TitleOpts(title="Graph-基本示例"),)
)
c.render_notebook()
来源:oschina
链接:https://my.oschina.net/u/3750423/blog/4283396