人工智能入门第一课:手写字体识别及可视化项目(手写画板)(mnist),使用技术(Django+js+tensorflow+html+bootstrap+inspinia框架)
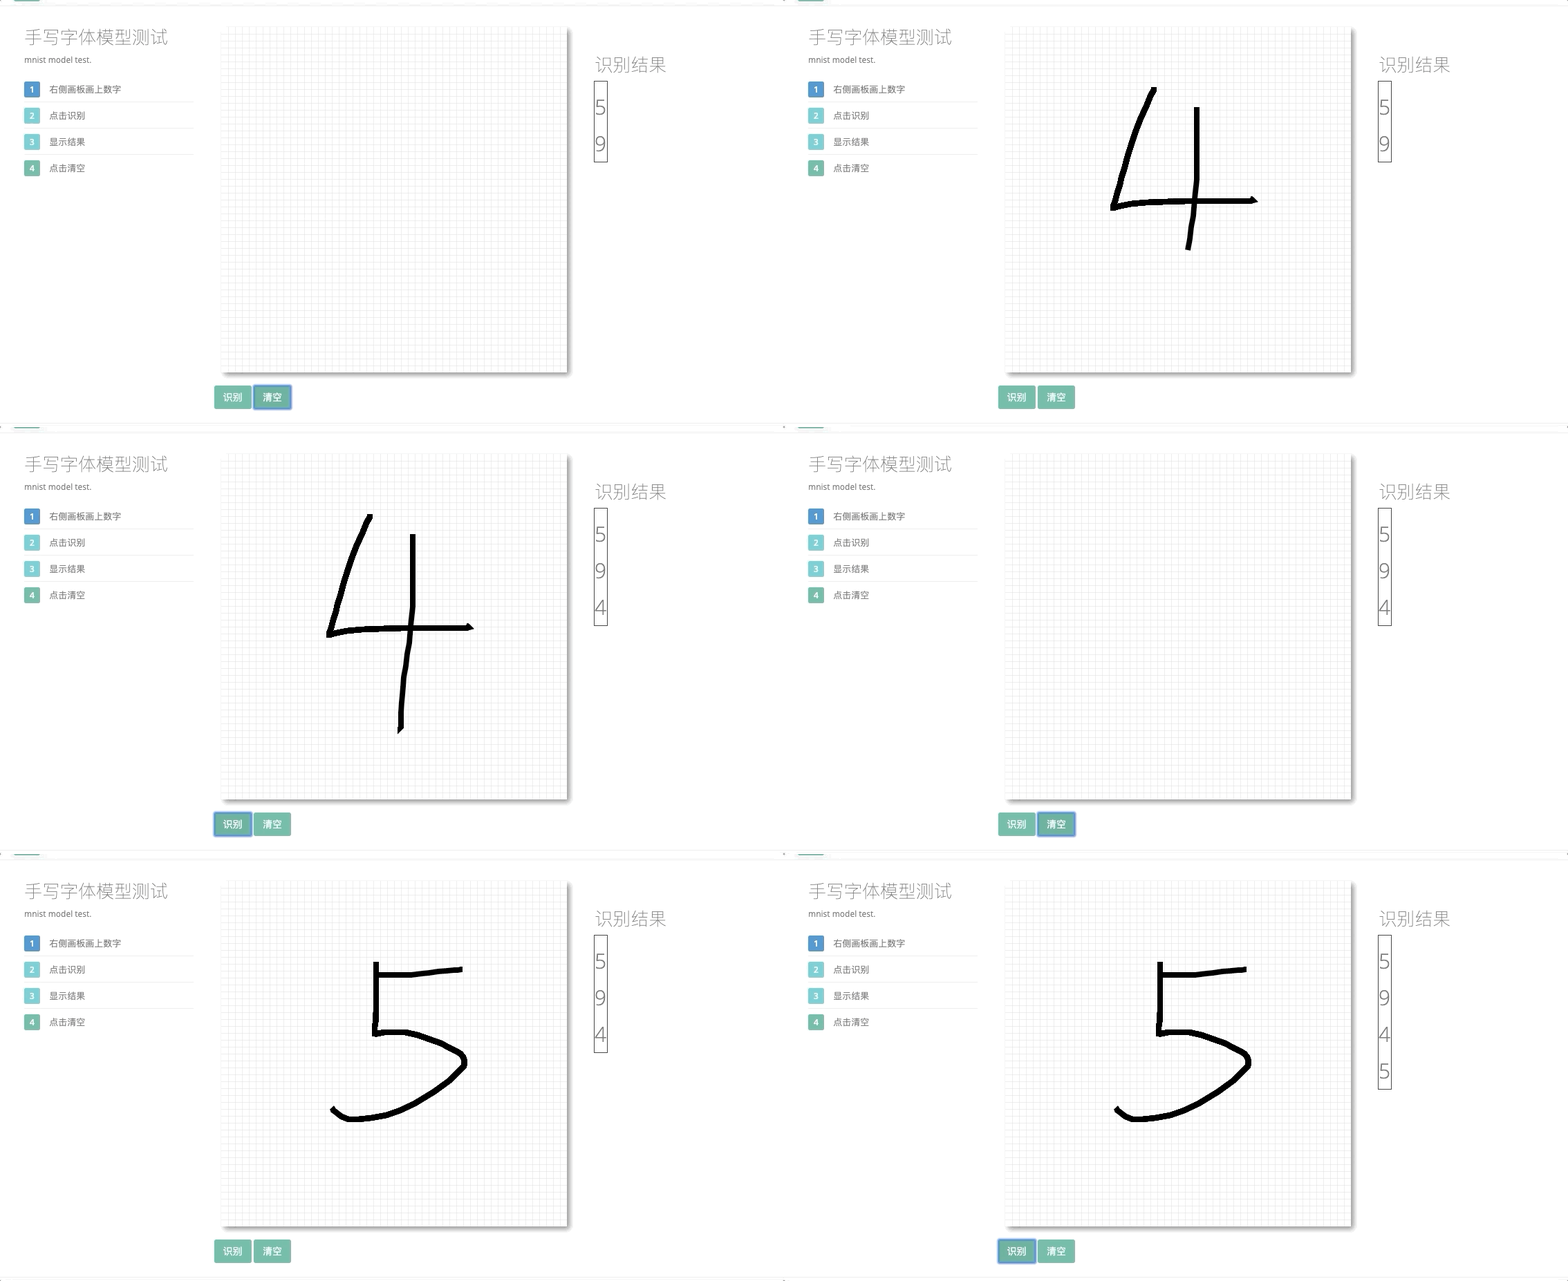
直接上图,项目效果
1.训练模型
项目结构
运用tensorflow
70行代码即可搞定训练,首先大家需要下载mnist的数据集
大家可自行百度,形式如下
创建mnist_train.py文件
导入代码
# -*-coding:utf-8 -*-
import tensorflow as tf
from tensorflow.examples.tutorials.mnist import input_data

learning_rate = 0.001
TRAINING_STEPS = 100000
BATCH_SIZE = 32

def conv_layer(input, in_channel, out_channel):
    # 定义卷积层
    w = tf.Variable(tf.truncated_normal([5, 5, in_channel, out_channel], stddev=0.1)) #生成一个5x5的矩阵
    b = tf.Variable(tf.constant(0.1, shape=[out_channel]))
    conv = tf.nn.conv2d(input, w, strides=[1, 1, 1, 1], padding="SAME")
    act = tf.nn.relu(conv + b)
    return act

def fc_layer(input, size_in, size_out):
    # 定义全连接层
    w = tf.Variable(tf.truncated_normal([size_in, size_out], stddev=0.1))
    b = tf.Variable(tf.constant(0.1, shape=[size_out]))
    fc =tf.matmul(input, w)+b
    return fc

#converlution_conv
def inference(image, keep_prob):
    # conv1
    conv1 = conv_layer(image,1, 32)
    conv1_pool = tf.nn.max_pool(conv1, ksize=[1,2,2,1], strides=[1,2,2,1], padding="SAME")
    # conv2
    conv2= conv_layer(conv1_pool, 32, 64)
    conv2_pool = tf.nn.max_pool(conv2, ksize=[1,2,2,1], strides=[1,2,2,1], padding="SAME")
    conv_flaten = tf.reshape(conv2_pool, shape=[-1, 7*7*64])
    # fc1
    fc1 = tf.nn.relu(fc_layer(conv_flaten, 7*7*64, 1024))
    fc1 = tf.nn.dropout(fc1, keep_prob=keep_prob)
    model_output=tf.add(fc_layer(fc1, 1024, 10),0,name='model_output')
    return model_output

def inputs():
    # 定义输入
    keep_prob = tf.placeholder(tf.float32, name="keep_prob")
    x = tf.placeholder(tf.float32, shape=[None, 784], name="x")
    y = tf.placeholder(tf.float32, shape=[None, 10], name="labels")
    return x, y, keep_prob


def loss(y_pred, y_real):
    # 定义交叉熵误差
    xent = tf.reduce_mean(tf.nn.softmax_cross_entropy_with_logits(
            logits=y_pred, labels=y_real))
    return xent
def train_optimizer(loss, global_step=None):
    # 定义训练优化器
    train_step = tf.train.AdamOptimizer(learning_rate).minimize(loss, global_step=global_step)
    return train_step

def accuracy(y_pred, y_real):
    # 定义预测准确率
    correct_prediction = tf.equal(tf.argmax(y_pred, 1), tf.argmax(y_real, 1))
    acc = tf.reduce_mean(tf.cast(correct_prediction, tf.float32))
    return acc

def train(mnist):
    x, y, keep_prob = inputs()
    x_image = tf.reshape(x, [-1, 28, 28, 1])
    global_step = tf.Variable(0, trainable=False)
    logits = inference(x_image, keep_prob=keep_prob)   # 定义模型
    losses = loss(y_pred=logits, y_real=y)
    train_step = train_optimizer(losses, global_step=global_step)
    acc = accuracy(y_pred=logits, y_real=y)
    with tf.Session() as sess:
        sess.run(tf.global_variables_initializer())
        for i in range(TRAINING_STEPS):
            xs, ys = mnist.train.next_batch(BATCH_SIZE)
            print('hello')
            print(xs.shape)
            _, loss_value, step = sess.run([train_step, losses, global_step],
                                           feed_dict={x: xs, y: ys, keep_prob:0.5})
            if i % 200 ==0:
                print("After %d training step(s), loss on training batch is %g."
                      % (step, loss_value))
            if i % 1000 == 0:
                valid_acc = sess.run(acc, feed_dict={x: mnist.validation.images, y: mnist.validation.labels, keep_prob:1.})
                print("After %d training step(s), accuracy on validation is %g." % (step, valid_acc))
        test_acc = sess.run(acc, feed_dict={x:mnist.test.images, y:mnist.test.labels, keep_prob:1.})
        print("After %d training step(s), accuracy on test is %g." % (TRAINING_STEPS, test_acc))
        saver=tf.train.Saver()
        saver.save(sess,'my_model/mnist_model.ckpt')
if __name__ == "__main__":
    mnist = input_data.read_data_sets("data/mnist_data/", one_hot=True)
    train(mnist)
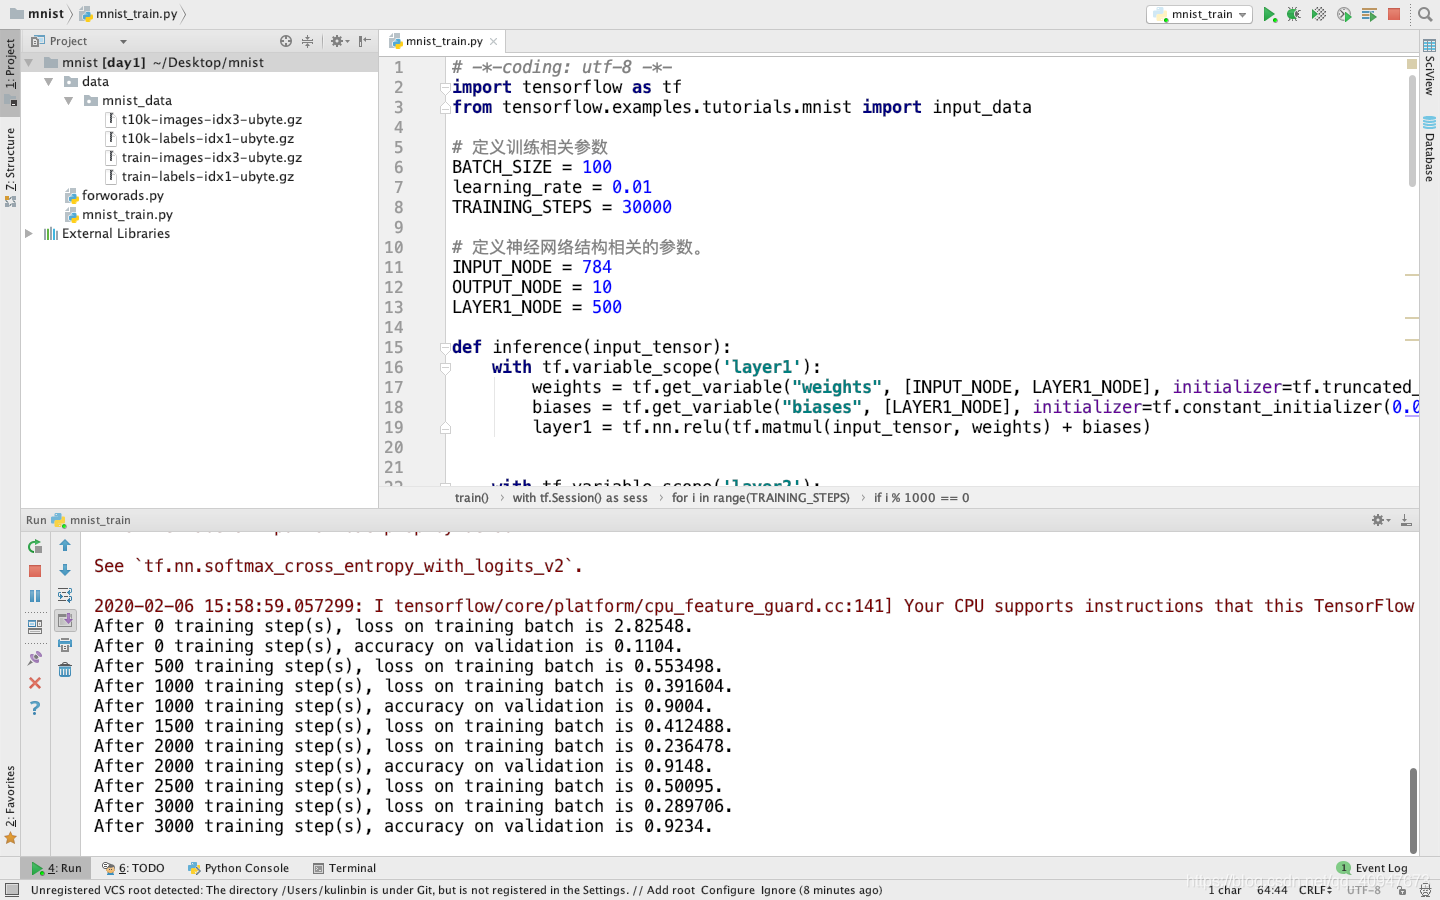
运行此文件,开始训练
大家训练个50000步左右应该就差不多啦
我此处为啦方便就只训练啦和10000步左右,差不多90%以上的准确率
训练完成后会有,四个文件,此四个文件即为模型,一定要保存好,接下来就是应用模型啦
2.模型的可视化应用
既然是手写字体模型,那一定需要画板来进行可视化啦,此处我使用Django来构建一个web应用,创建Django前面的博客已经演示过,此处不再重复,不懂的同学前往https://blog.csdn.net/qq_40947673/article/details/104106573
项目架构如下
那最重要的就是前端交互啦
奉上前端
{% extends "index.html" %}
{% block details %}

<div class="row border-bottom white-bg dashboard-header">
<div class="col-sm-3">
<h2>手写字体模型测试</h2>
<small>mnist model test.</small>
<ul class="list-group clear-list m-t">
<li class="list-group-item fist-item">
<span class="label label-success">1</span> 右侧画板画上数字
</li>
<li class="list-group-item">
<span class="label label-info">2</span> 点击识别
</li>
<li class="list-group-item">
<span class="label label-info">3</span> 显示结果
</li>
<li class="list-group-item">
<span class="label label-primary">4</span> 点击清空
</li>
</ul>
</div>
<div class="col-sm-6">
<canvas id="canvas" width="500" height="500">
</canvas>
<div class="row text-left">
<div class="col-xs-4">
<button onclick="shibie()" class="btn btn-primary m-t">识别</button>
<button onclick="qingkong()" class="btn btn-primary m-t" >清空</button>
</div>
</div>
</div>
<div class="col-sm-3">
<div class="statistic-box">
<div class="row text-center">
<div class="col-lg-6">
<h2>识别结果</h2>
<table id="tbl" border="1">
<tbody id="body"></tbody>
</table>
</div>
</div>
</div>
</div>
<style>
#canvas {
background: #fff;
cursor: crosshair;
margin-left: 10px;
margin-top: 10px;
-webkit-box-shadow: 4px 4px 8px rgba(0, 0, 0, 0.5);
-moz-box-shadow: 4px 4px 8px rgba(0, 0, 0, 0.5);
box-shadow: 4px 4px 8px rgba(0, 0, 0, 0.5);
}
</style>
<script>
var canvas = document.querySelector("canvas");
var cobj = canvas.getContext("2d");
var data = [];
var s = "pen";
var c = "#000";
var w = "8";
function drawGrid(stepX, stepY, color, lineWidth) {
cobj.beginPath();
// 创建垂直格网线路径
for (var i = 0.5 + stepX; i < canvas.width; i += stepX) {
cobj.moveTo(i, 0);
cobj.lineTo(i, canvas.height);
}
// 创建水平格网线路径
for (var j = 0.5 + stepY; j < canvas.height; j += stepY) {
cobj.moveTo(0, j);
cobj.lineTo(canvas.width, j);
}
// 设置绘制颜色
cobj.strokeStyle = color;
// 设置绘制线段的宽度
cobj.lineWidth = lineWidth;
// 绘制格网
cobj.stroke();
// 清除路径
cobj.beginPath();
}
drawGrid(10, 10, 'lightgray', 0.5);
canvas.onmousedown = function (e) {
var ox = e.offsetX;
var oy = e.offsetY;
var draw = new Draw(cobj, {
color: c,
width: w
});
cobj.beginPath();
cobj.moveTo(ox, oy);
canvas.onmousemove = function (e) {
var mx = e.offsetX;
var my = e.offsetY;
if (s != "eraser") {
if (data.length != 0) {
cobj.putImageData(data[data.length - 1], 0, 0, 0, 0, 500, 500); //将某个图像数据放置到画布指定的位置上 后面四个参数可省略
}
}
// cobj.strokeRect(ox,oy,mx-ox,my-oy);
// cobj.beginPath()
draw[s](ox, oy, mx, my);
};
document.onmouseup = function () {
data.push(cobj.getImageData(0, 0, 500, 500)); //获取画布当中指定区域当中所有的图形数据
canvas.onmousemove = null;
document.onmouseup = null;
}
};
function qingkong() {
cobj.clearRect(0, 0, 500, 500);
data = [];
drawGrid(10, 10, 'lightgray', 0.5);
}
class Draw {
constructor(cobj, option) {
this.cobj = cobj;
this.color = option.color;
this.width = option.width;
this.style = option.style;
}
init() { //初始化
this.cobj.strokeStyle = this.color;
this.cobj.fillStyle = this.color;
this.cobj.lineWidth = this.width;
}
pen(ox, oy, mx, my) {
this.init();
this.cobj.lineTo(mx, my);
this.cobj.stroke();
}
}
</script>
<script>
function shibie() {
var img = document.getElementById("canvas").toDataURL("image/png");
img = img.replace(/^data:image\/(png|jpg);base64,/, "");
sendData = {
"img": img,
};
$.ajax({
traditional: true,
url: "/mnist/",
type: 'get',
data: sendData,
dataType: "json",
success: function (data) {
{#alert(data["res"])#}
var html = data["res"];
var html3 = document.createElement("h1");
html3.innerHTML = html;
$("#body").append(html3);
}
})
}
</script>
</div>
{% endblock %}
最后结果
由于细节太多就不一一叙述,git:https://github.com/kulinbin/mnist_web
来源:CSDN
作者:kulinbin
链接:https://blog.csdn.net/qq_40947673/article/details/104197298