场景
C#窗体应用中使用ZedGraph曲线插件绘制图表:
https://blog.csdn.net/BADAO_LIUMANG_QIZHI/article/details/99716066
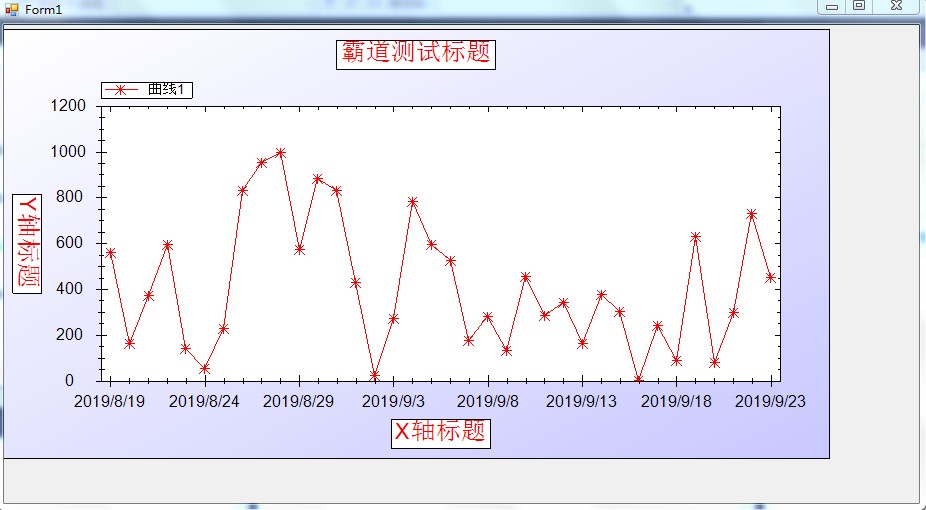
在上面已经实现基本的曲线图之后,效果如下:

当然这不是我们的效果,还要对其属性进行设置。
但是毕竟其属性和方法说明都是英文,所以整理了一些常用属性和方法。
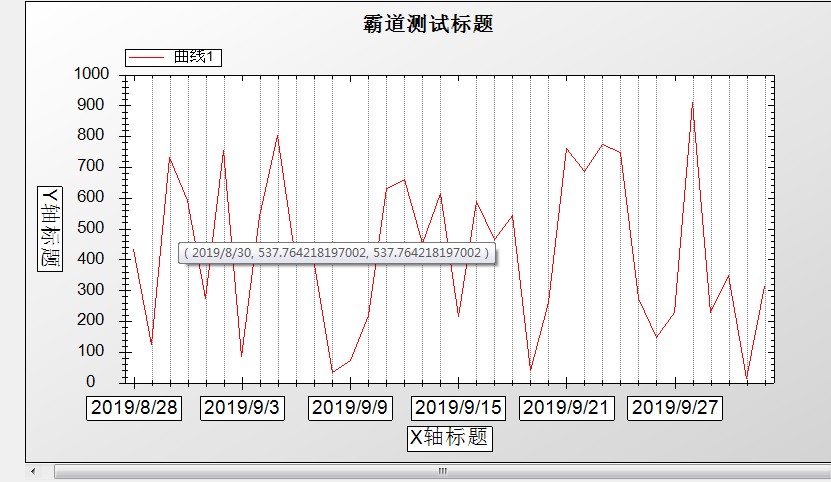
调整之后的效果
控件下载
https://download.csdn.net/download/badao_liumang_qizhi/11578445
英文手册下载
https://download.csdn.net/download/badao_liumang_qizhi/11578491
实现
曲线整体属性设置
 //是否允许横向缩放
            this.zedGraphControl1.IsEnableHZoom = true;
            //是否允许纵向缩放
            this.zedGraphControl1.IsEnableVZoom = true;
            //是否允许缩放
            this.zedGraphControl1.IsEnableZoom = true;
            //是否显示右键菜单
            this.zedGraphControl1.IsShowContextMenu = true;
            //复制图像时是否显示提示信息
            this.zedGraphControl1.IsShowCopyMessage = true;
            //鼠标在图表上移动时是否显示鼠标所在点对应的坐标 默认为false
            this.zedGraphControl1.IsShowCursorValues = true;
            //是否显示横向滚动条
            this.zedGraphControl1.IsShowHScrollBar = true;
            //是否显示纵向滚动条
            this.zedGraphControl1.IsShowVScrollBar = true;
            //鼠标经过图表上的点时是否显示该点所对应的值 默认为false
            this.zedGraphControl1.IsShowPointValues = true;
            //使用滚轮时以鼠标所在点为中心进行缩放还是以图形中心进行缩放
            //this.zedGraphControl1.IsZoomOnMouseCenter = true;
坐标轴属性设置
//X轴类型
            myPane.XAxis.Type = AxisType.Text;
            //显示小刻度 是false则看不到效果
            myPane.XAxis.MinorGrid.IsVisible = true;
            //线的颜色
            myPane.XAxis.Color = Color.Black;
            //点线中点与点之间的间隔
            myPane.XAxis.MinorGrid.DashOff = 1f;
            //点线中点的长度
            myPane.XAxis.MinorGrid.DashOn = 1f;
            //画笔宽度
            myPane.XAxis.MinorGrid.PenWidth = 1f;
坐标轴上刻度设置
//X轴文本取值
            myPane.XAxis.Scale.TextLabels = labels;
            //第一个刻度从哪里开始
            myPane.XAxis.Scale.BaseTic = 1;
            //刻度值的字体属性
            myPane.XAxis.Scale.FontSpec = myFont;
图表颜色设置
//填充图表颜色
myPane.Fill = new Fill(Color.White, Color.LightGray, 45.0f);
曲线样式设置
 // 用list1生产一条曲线,标注是“曲线1”
            //SymbolType,枚举代表曲线的样式
            //Square = 0,
            //Diamond = 1,
            //Triangle = 2,
            //Circle = 3,
            //XCross = 4,
            //Plus = 5,
            //Star = 6,
            //TriangleDown = 7,
            //HDash = 8,
            //VDash = 9,
            //UserDefined = 10,
            //Default = 11,
            //None = 12,
            LineItem myCurve = myPane.AddCurve("曲线1", list1, Color.Red, SymbolType.None);
图表标题设置
//设置图表标题 和 x y 轴标题
            myPane.Title.Text = "霸道测试标题";

            myPane.XAxis.Title.Text = "X轴标题";

            myPane.YAxis.Title.Text = "Y轴标题";

            //更改标题的字体

            FontSpec myFont = new FontSpec("Arial",16,Color.Black,false,false,false);

            myPane.XAxis.Title.FontSpec = myFont;

            myPane.YAxis.Title.FontSpec = myFont;
来源:https://www.cnblogs.com/badaoliumangqizhi/p/11422087.html