1.多项式插值函数
%%多项式插值
%%说明:precision为精度,越大则图像越精细,attribute是属性值,当未知函数表达式但已知函数值时为1,否则为0
function PI = Polynomial_interpolation(f,X,precision,attribute)
X = sort(X);
if attribute == 0
    [m,n] = size(X);MAX = max([m,n]);
    X = reshape(X,1,MAX);error = [];
    for i = 1:MAX
        Y(i) = subs(f,X(i));
    end
    Y_value =double(Y);
    a = min(X);b = max(X);
    t = a:(b-a)/precision:b;
    T = zeros(1,precision+1);
    Yreal = subs(f,t);
    Coe = vpa(Polynomial_interpolation_cofficient(f,X,attribute),4);
    for i = 1:1:precision+1
        T(i) = Polynomial_value(Coe,t(i));
    end
    for i=1:MAX
        error(i) = abs(Y(i)-Polynomial_value(Coe,X(i)));
    end

    %%作图
    h=figure;
    set(h,'color','w');
    [hAx,hLine1,hLine2] = plotyy(t,T,X,Y,'plot','stem');
    title('多项式插值');
    xlabel('Variable x');
    ylabel(hAx(1),'Variable');
    ylabel(hAx(2),'Variable');
    grid on
    hold on
    plot(t,Yreal);
    legend('Yreal:真实图像','Y:拟合多项式图像','T:实际数据');

    %%显示坐标
    for i = 1:MAX
        text(X(i),Y_value(i),['(',num2str(X(i)),',',num2str(Y_value(i)),')'],'color',[0.02 0.79 0.99]);
    end

    disp('误差值为');error
elseif attribute ==1
    [m,n] = size(X);MAX = max([m,n]);X = reshape(X,1,MAX);f = reshape(f,1,MAX);
    a = min(X);b = max(X);
    t = a:(b-a)/precision:b;
    T = zeros(1,precision+1);
    Coe = vpa(Polynomial_interpolation_cofficient(f,X,attribute),4);
    for i = 1:1:precision+1
        T(i) = Polynomial_value(Coe,t(i));
    end

    h=figure;
    set(h,'color','w');
    plot(t,T,'b',X,f,'g*');
    grid on
    title('多项式插值');
    xlabel('Variable x');
    ylabel('Variable y');
    legend('Y:拟合多项式图像','T:已知数据');

    for i = 1:MAX
        text(X(i),f(i),['(',num2str(X(i)),',',num2str(f(i)),')'],'color',[0.02 0.79 0.99]);
    end
end

syms x;
PI=vpa(Polynomial_value(Coe,x),4);
end
2.多项式函数值
%%多项式函数值
function PV = Polynomial_value(P,t)
[m,n] = size(P);
MAX = max([m,n]);
sum = 0;
for i = MAX:-1:1
    sum = sum+P(i)*Power_function(i-1,t);
end
PV = sum;
%%幂函数
    function pf = Power_function(index,t)
        pf = t.^index;
    end
end
3.多项式系数
%%此函数可得出给定节点数减一的多项式系数
%%说明:attribute是属性值,当未知函数表达式但已知函数值时为1,否则为0
function PIC = Polynomial_interpolation_cofficient(f,X,attribute)
global MAX;global m;global n;global i;
X = sort(X);
if attribute == 0
    [m,n]=size(X);MAX=max([m,n]);
    X = reshape(X,1,MAX);
    A  = zeros(MAX,MAX);Y = zeros(1,MAX);
    for i = 1:MAX
        A(:,i) = (X').^(i-1);
        Y(i) = subs(f,X(i));
    end
    Coefficient = vpa(reshape(A\(Y'),1,MAX),4);
elseif attribute == 1
    [m,n]=size(X);MAX=max([m,n]);PIC=cell(1,MAX+1);
    X = reshape(X,1,MAX);
    A  = zeros(MAX,MAX);Y = reshape(f,1,MAX);
    for i = 1:MAX
        A(:,i) = (X').^(i-1);
    end
    Coefficient = vpa(reshape(A\(Y'),1,MAX),4);
end
disp('最高次数n=');
MAX-1
PIC=Coefficient;
%%多项式函数值
    function PV = Polynomial_value(P,t)
        [m,n] = size(P);
        MAX = max([m,n]);
        sum = 0;
        for i = MAX:-1:1
            sum = sum+P(i)*Power_function(i-1,t);
        end
        PV = sum;
        %%幂函数
        function pf = Power_function(index,t)
            pf = t.^index;
        end
    end
end
4.一个例子
clear all
clc
precision=500;
X=1:1:6;
R1=reshape(rand(6),1,36);
R2=reshape(rand(12),1,144);
R=zeros(1,6);
for i=1:6
    R(i)=R1(6*i)*R2(24*i)*100;
end

%%已知函数
disp('已知函数的多项式拟合');
syms x;
f=x*sin(x^2)*exp(-x^2)+log(abs(sin(x)));
Polynomial_interpolation(f,X,precision,0)

%%已知函数数值
disp('已知函数值的多项式拟合');
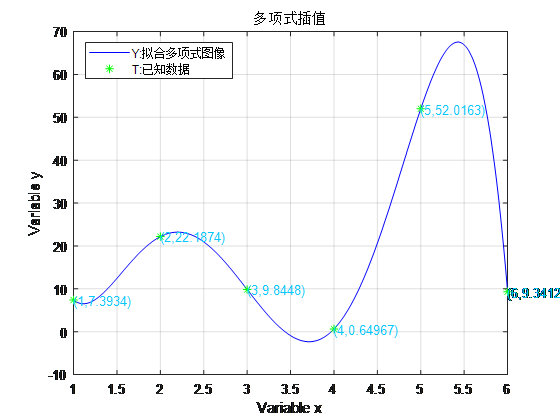
Polynomial_interpolation(R,X,precision,1)
结果
已知函数的多项式拟合
最高次数n=
ans =
     5
误差值为
error =
   1.0e-08 *
    0.0066    0.0092    0.0027    0.0473    0.1507    0.3463
ans =
0.1248*x^5 - 2.291*x^4 + 15.64*x^3 - 48.61*x^2 + 66.56*x - 31.29
已知函数值的多项式拟合
最高次数n=
ans =
     5
ans =
- 1.993*x^5 + 31.02*x^4 - 175.7*x^3 + 444.1*x^2 - 491.6*x + 201.5


%%多项式插值%%说明:precision为精度,越大则图像越精细,attribute是属性值,当未知函数表达式但已知函数值时为1,否则为0function PI = Polynomial_interpolation(f,X,precision,attribute)X = sort(X);if attribute == 0 [m,n] = size(X);MAX = max([m,n]); X = reshape(X,1,MAX);error = []; for i = 1:MAX Y(i) = subs(f,X(i)); end Y_value =double(Y); a = min(X);b = max(X); t = a:(b-a)/precision:b; T = zeros(1,precision+1); Yreal = subs(f,t); Coe = vpa(Polynomial_interpolation_cofficient(f,X,attribute),4); for i = 1:1:precision+1 T(i) = Polynomial_value(Coe,t(i)); end for i=1:MAX error(i) = abs(Y(i)-Polynomial_value(Coe,X(i))); end %%作图 h=figure; set(h,'color','w'); [hAx,hLine1,hLine2] = plotyy(t,T,X,Y,'plot','stem'); title('多项式插值'); xlabel('Variable x'); ylabel(hAx(1),'Variable'); ylabel(hAx(2),'Variable'); grid on hold on plot(t,Yreal); legend('Yreal:真实图像','Y:拟合多项式图像','T:实际数据'); %%显示坐标 for i = 1:MAX text(X(i),Y_value(i),['(',num2str(X(i)),',',num2str(Y_value(i)),')'],'color',[0.02 0.79 0.99]); end disp('误差值为');errorelseif attribute ==1 [m,n] = size(X);MAX = max([m,n]);X = reshape(X,1,MAX);f = reshape(f,1,MAX); a = min(X);b = max(X); t = a:(b-a)/precision:b; T = zeros(1,precision+1); Coe = vpa(Polynomial_interpolation_cofficient(f,X,attribute),4); for i = 1:1:precision+1 T(i) = Polynomial_value(Coe,t(i)); end h=figure; set(h,'color','w'); plot(t,T,'b',X,f,'g*'); grid on title('多项式插值'); xlabel('Variable x'); ylabel('Variable y'); legend('Y:拟合多项式图像','T:已知数据'); for i = 1:MAX text(X(i),f(i),['(',num2str(X(i)),',',num2str(f(i)),')'],'color',[0.02 0.79 0.99]); endend
syms x;PI=vpa(Polynomial_value(Coe,x),4);end
来源:https://www.cnblogs.com/guliangt/p/12112771.html