R可处理的数据类型(模式)包括数值型、字符型、逻辑型、复数型、原生型(字节),存储数据的结构包括标量、向量、矩阵、数组、数据框、列表。
1.向量
向量是一维数组,其中的元素必须是相同的类型。
1.1 向量的创建
1 a <- c(1,2,3,4,5)
2 b <- c('one','two')
1.2 向量的索引
从0开始,而不是从1开始。
1 > a <- c(1,2,3,4,5)
2 > a[3]
3 [1] 3
4 > a[1:3]
5 [1] 1 2 3
2.矩阵
矩阵是一个二维数组,其中的元素也都拥有相同的模式。
2.1 矩阵的创建
默认按列进行填充。
1 > cells <- c(1,4,6,9,3,5)
2 > rnames <- c('R1','R2')
3 > cnames <- c('C1','C2','C3')
4 > m <- matrix(cells,nrow = 2,ncol = 3,byrow = T,dimnames = list(rnames,cnames))
5 > m
6    C1 C2 C3
7 R1  1  4  6
8 R2  9  3  5
2.2 矩阵的索引
 1 > m
 2    C1 C2 C3
 3 R1  1  4  6
 4 R2  9  3  5
 5 > m[1,2]
 6 [1] 4
 7 > m[1,]
 8 C1 C2 C3
 9  1  4  6
10 > m[1,c(2,3)]
11 C2 C3
12  4  6
13 > m[c(1,2),c(2,3)]
14    C2 C3
15 R1  4  6
16 R2  3  5
3.数组
数组的维度可以大于2,只能包含相同模式的元素。当维度为2时,数组退化成矩阵;当维度为1时,数组退化成向量。
3.1 数组的创建和索引
创建数组时需要定义每个维度的大小。
 1 > dim1<-c('A1','A2')
 2 > dim2<-c('B1','B2','B3')
 3 > dim3<-c('C1','C2','C3','C4')
 4 > z<-array(1:24,dim = c(2,3,4),dimnames = list(dim1,dim2,dim3))
 5 > z
 6 , , C1
 7
 8    B1 B2 B3
 9 A1  1  3  5
10 A2  2  4  6
11
12 , , C2
13
14    B1 B2 B3
15 A1  7  9 11
16 A2  8 10 12
17
18 , , C3
19
20    B1 B2 B3
21 A1 13 15 17
22 A2 14 16 18
23
24 , , C4
25
26    B1 B2 B3
27 A1 19 21 23
28 A2 20 22 24
29
30 > z[1,2,3]
31 [1] 15
4.数据框
向量、矩阵、数组都要求其中的数据是相同的模式;而在数据框中,不同的列可以包含不同模式的数据,每一列的数据模式要相同。
4.1 数据框的创建
 1 > patientID<-c(1,2,3,4)
 2 > age<-c(25,34,28,52)
 3 > diabetes<-c('type1','type2','type3','type4')
 4 > status<-c('poor','improved','excellent','poor')
 5 > patientdata<-data.frame(patientID,age,diabetes,status)
 6 > patientdata
 7   patientID age diabetes    status
 8 1         1  25    type1      poor
 9 2         2  34    type2  improved
10 3         3  28    type3 excellent
11 4         4  52    type4      poor
4.2 选取数据框中的元素
 1 > patientdata
 2   patientID age diabetes    status
 3 1         1  25    type1      poor
 4 2         2  34    type2  improved
 5 3         3  28    type1 excellent
 6 4         4  52    type1      poor
 7 > #方式1:使用索引
 8 > patientdata[1,2]
 9 [1] 25
10 > patientdata[1:2]
11   patientID age
12 1         1  25
13 2         2  34
14 3         3  28
15 4         4  52
16 > #方式2:使用变量的名称
17 > patientdata[c('diabetes','status')]
18   diabetes    status
19 1    type1      poor
20 2    type2  improved
21 3    type1 excellent
22 4    type1      poor
23 > #方式3:使用$
24 > patientdata$age
25 [1] 25 34 28 52
26 > #生成diabetes和status的列联表
27 > table(patientdata$diabetes,patientdata$status)
28
29         excellent improved poor
30   type1         1        0    2
31   type2         0        1    0
4.3 attach()、detach()
attach()将数据框添加到R的搜索路径中,detach()将数据框从搜索路径中移除。
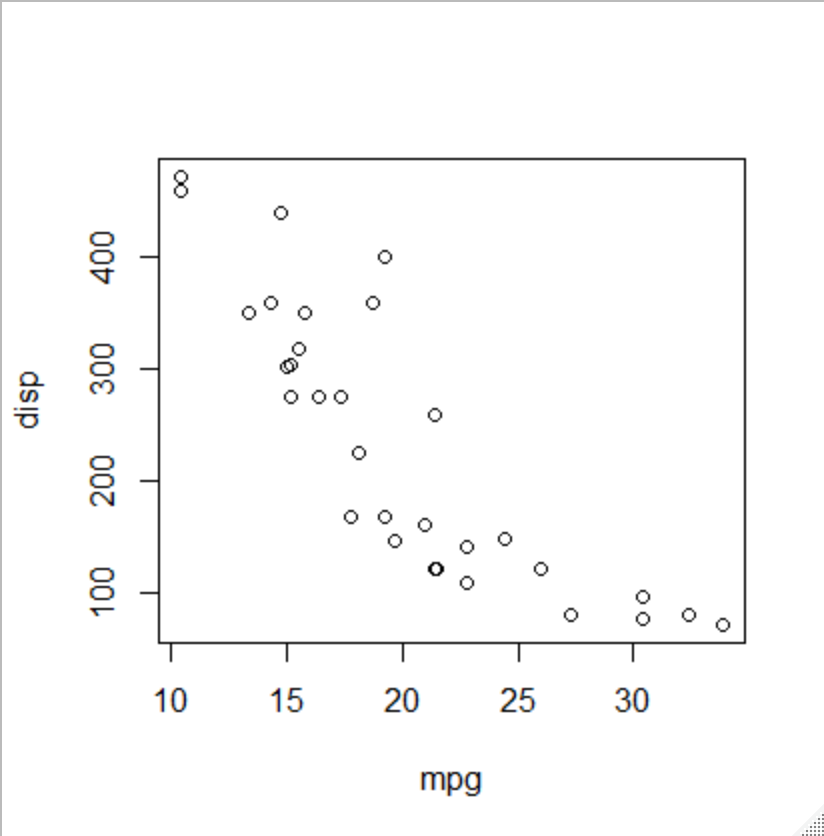
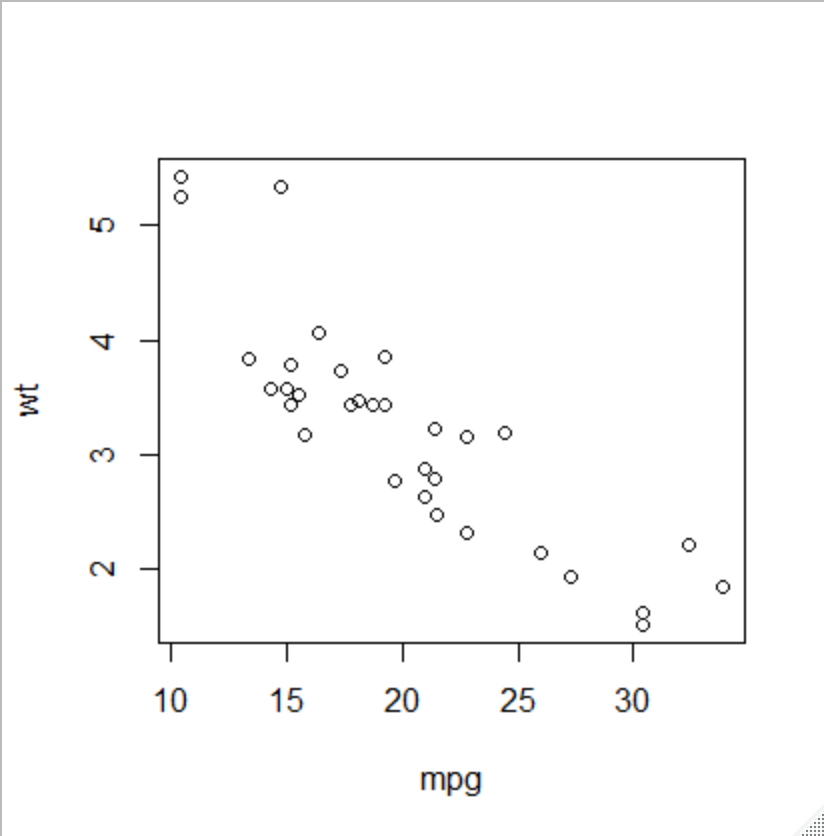
 1 > #使用$
 2 > summary(mtcars$mpg)
 3    Min. 1st Qu.  Median    Mean 3rd Qu.    Max.
 4   10.40   15.43   19.20   20.09   22.80   33.90
 5 > plot(mtcars$mpg,mtcars$disp)
 6 > plot(mtcars$mpg,mtcars$wt)
 7
 8 > #使用attach()、detach()
 9 > attach(mtcars)
10 > summary(mpg)
11    Min. 1st Qu.  Median    Mean 3rd Qu.    Max.
12   10.40   15.43   19.20   20.09   22.80   33.90
13 > plot(mpg,disp)
14 > plot(mpg,wt)
15 > detach(mtcars)
画出的图形为:


4.4 with()
with()是一种更好的方式。
1 > with(mtcars,{
2 +   print(summary(mpg))
3 +   plot(mpg,disp)
4 +   plot(mpg,wt)
5 + })
6    Min. 1st Qu.  Median    Mean 3rd Qu.    Max.
7   10.40   15.43   19.20   20.09   22.80   33.90
4.5 实例标识符
以patientID区分不同的个体,通过rowname指定。
1 > patientdata <- data.frame(patientID,age,diabetes,status,row.names = patientID)
5.因子
类别变量分为名义变量和有序类别变量,它们都称为因子。它决定了数据的分析方式。factor()函数用一个整数向量来存储类别变量。
5.1 名义变量
将diabetes变量存储为(1,2,1,1),内部关联为1=type1,2=type2。
1 > #类别变量
2 > diabetes<-c('type1','type2','type1','type1')
3 > diabetes<-factor(diabetes)
4 > diabetes
5 [1] type1 type2 type1 type1
6 Levels: type1 type2
5.2 有序变量
需要为factor()函数指定参数order=T,指定levels参数,覆盖默认排序。
1 > #有序类别变量
2 > status<-c('poor','improved','excellent','poor')
3 > status<-factor(status,ordered = T,levels = c('poor','improved','excellent'))
4 > status
5 [1] poor      improved  excellent poor
6 Levels: poor < improved < excellent
5.3 数值型变量
用levels和labels参数可以讲数值型变量编码因子。如将1指定为男,2指定为女,非1、2的为缺失值。
1 > sex<-c(1,2,2,1,3)
2 > sex<-factor(sex,levels = c(1,2),labels = c('male','female'))
3 > sex
4 [1] male   female female male   <NA>
5 Levels: male female
5.4 因子的使用
对于因子,R的统计概要会显示各水平(level)的频数。
 1 > #输入数据
 2 > patientID<-c(1,2,3,4)
 3 > age<-c(25,34,28,52)
 4 > diabetes<-c('type1','type2','type1','type1')
 5 > status<-c('poor','improved','excellent','poor')
 6
 7 > #因子
 8 > diabetes<-factor(diabetes)
 9 > status<-factor(status,ordered = T)
10
11 > #数据框
12 > patientdata<-data.frame(patientID,age,diabetes,status)
13
14 > #显示结构
15 > str(patientdata)
16 'data.frame':    4 obs. of  4 variables:
17  $ patientID: num  1 2 3 4
18  $ age      : num  25 34 28 52
19  $ diabetes : Factor w/ 2 levels "type1","type2": 1 2 1 1
20  $ status   : Ord.factor w/ 3 levels "excellent"<"improved"<..: 3 2 1 3
21
22 > #统计概要
23 > summary(patientdata)
24    patientID         age         diabetes       status
25  Min.   :1.00   Min.   :25.00   type1:3   excellent:1
26  1st Qu.:1.75   1st Qu.:27.25   type2:1   improved :1
27  Median :2.50   Median :31.00             poor     :2
28  Mean   :2.50   Mean   :34.75
29  3rd Qu.:3.25   3rd Qu.:38.50
30  Max.   :4.00   Max.   :52.00
6.列表
列表中的元素可以是向量、矩阵、数据框、列表。
Mylist有4个成分:一个字符串、一个数值型向量、一个矩阵、一个字符型向量。
 1 > g<-'My first list'
 2 > h<-c(25,26,18,39)
 3 > j<-matrix(1:10,nrow = 5)
 4 > k<-c('one','two','three')
 5
 6 > #创建列表
 7 > mylist<-list(title=g,ages=h,j,k)
 8 > mylist
 9 $title
10 [1] "My first list"
11
12 $ages
13 [1] 25 26 18 39
14
15 [[3]]
16      [,1] [,2]
17 [1,]    1    6
18 [2,]    2    7
19 [3,]    3    8
20 [4,]    4    9
21 [5,]    5   10
22
23 [[4]]
24 [1] "one"   "two"   "three"
25
26
27 > #输出第二个成分
28 > mylist[[2]]
29 [1] 25 26 18 39
30 > mylist[['ages']]
31 [1] 25 26 18 39
来源:https://www.cnblogs.com/zm-pop-pk/p/11594833.html