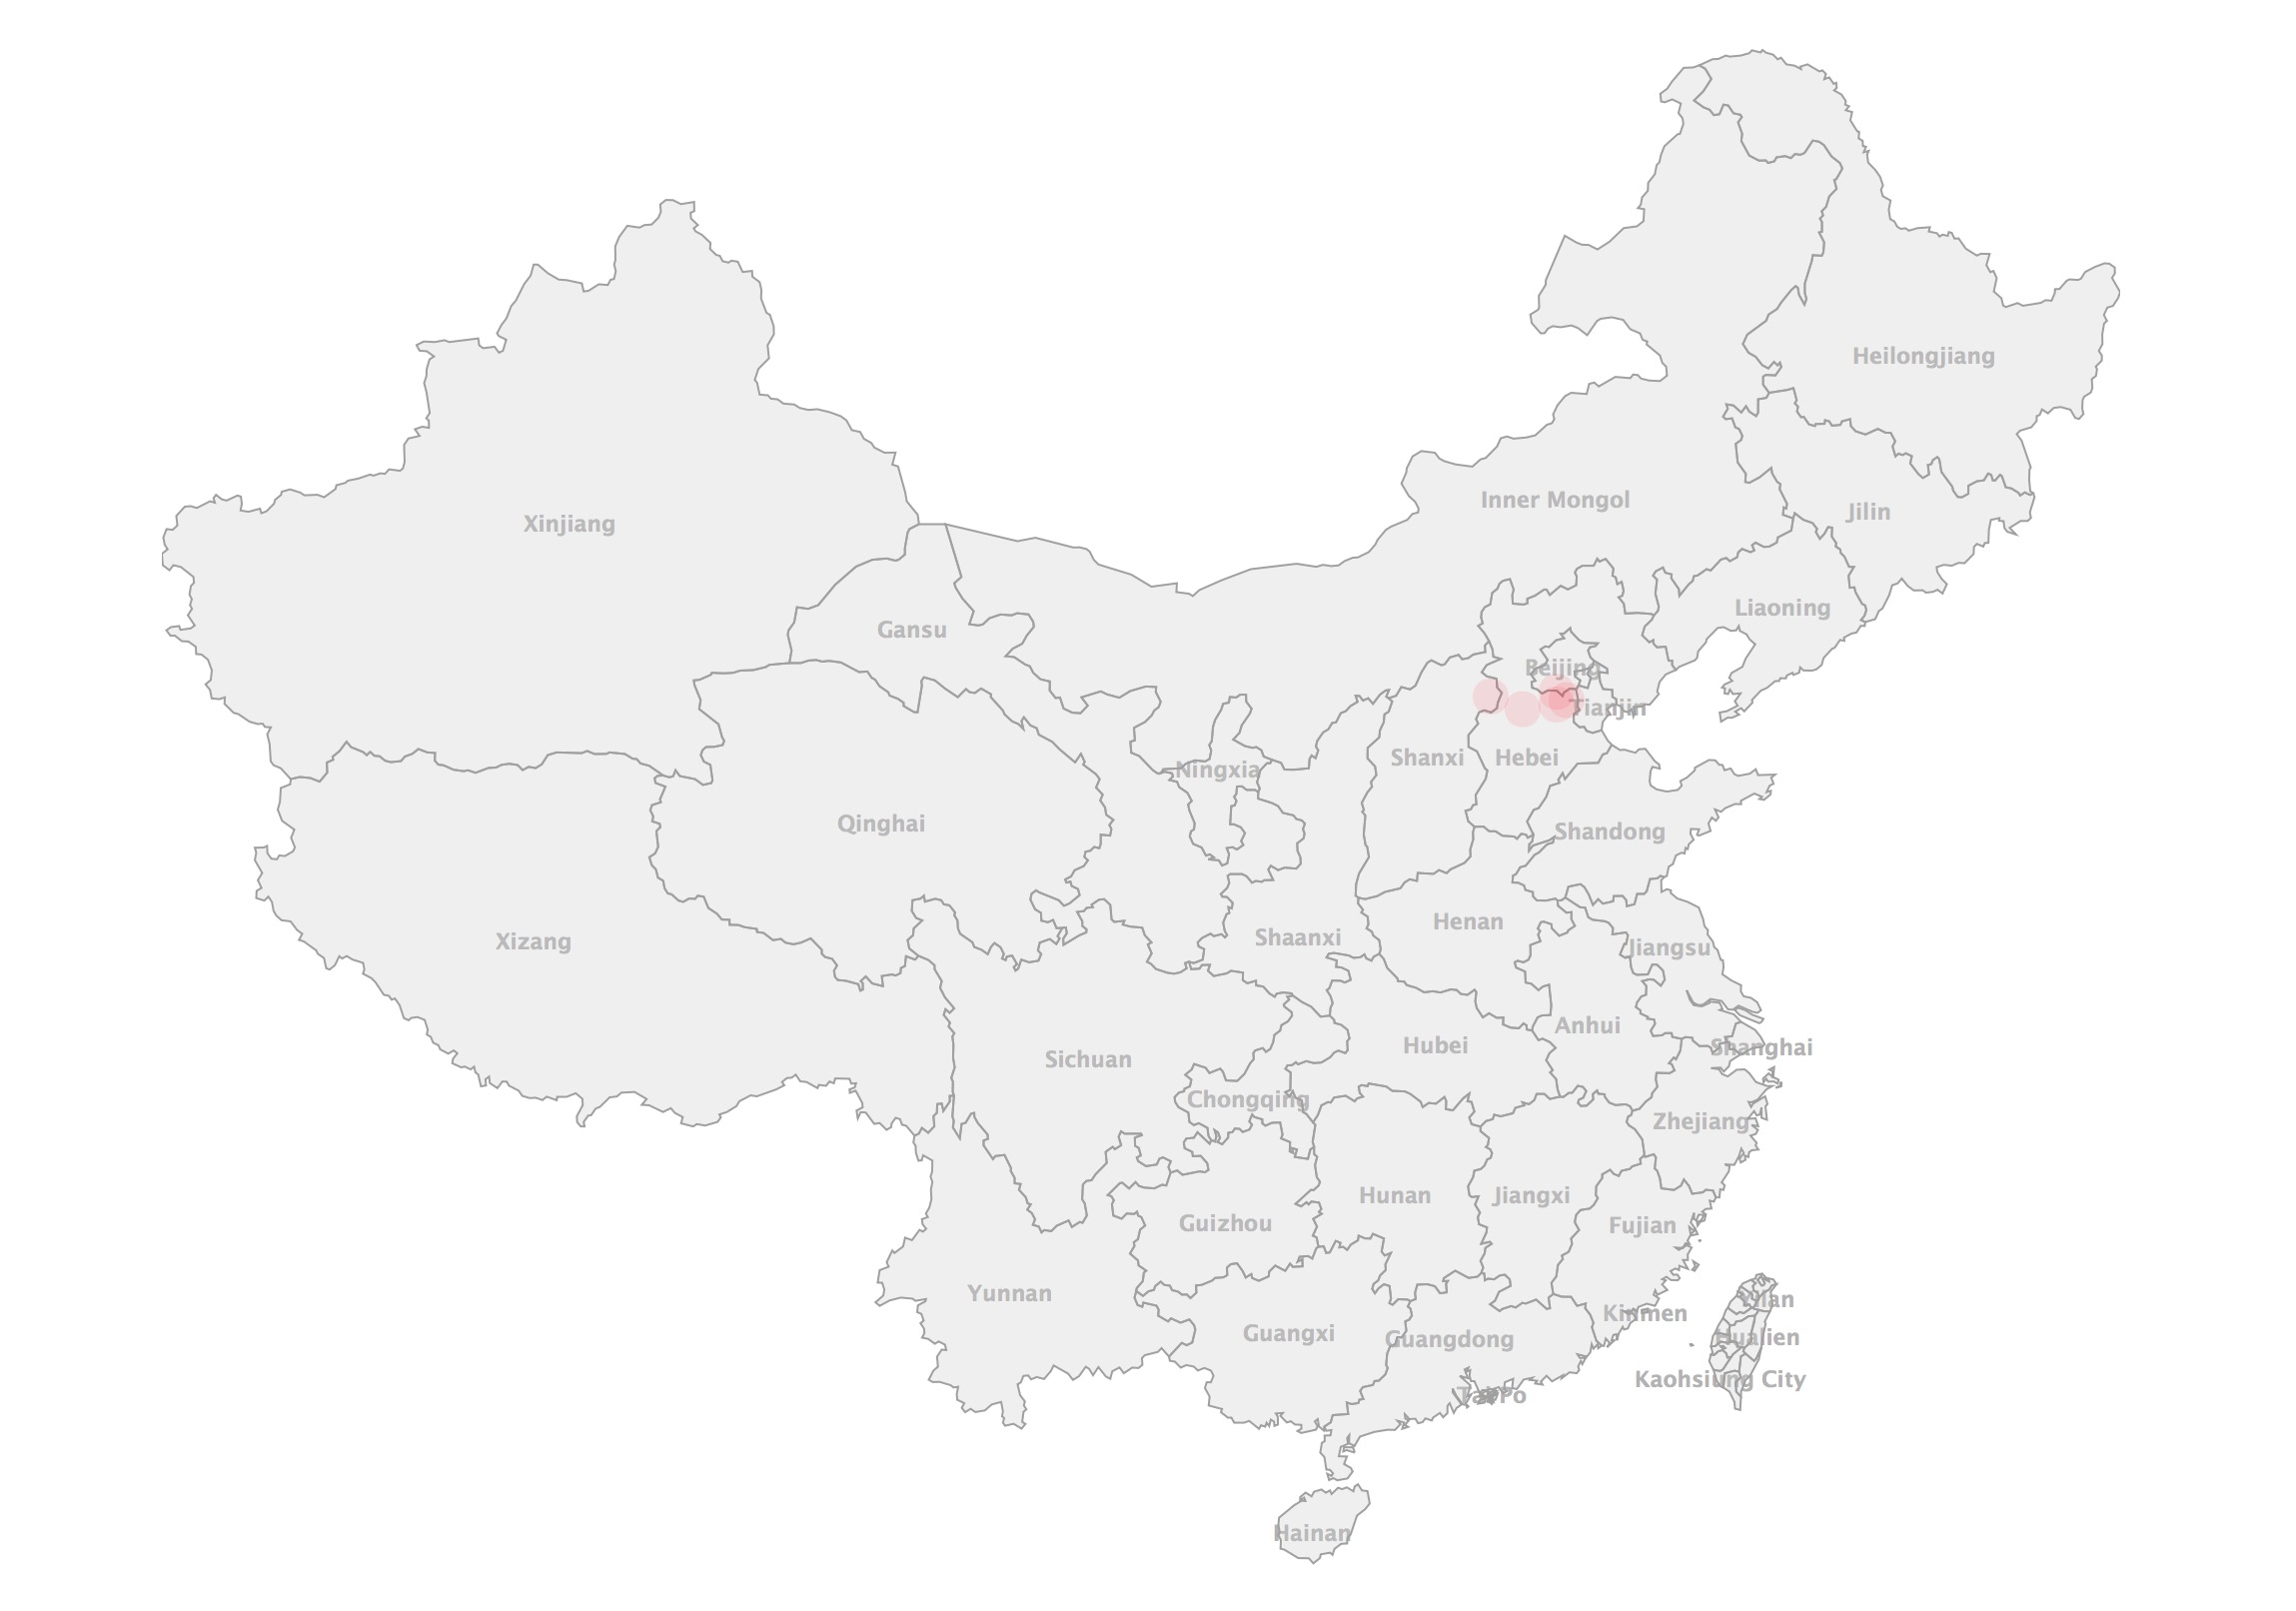
记录下使用highmaps绘制用户地图的过程
首先看效果

官方文档写的不清楚,很多配置项没有标明,比如设置用户点的颜色以及透明度
marker: {
    fillColor: 'rgba(255,0,0,0.1)',
    radius: 9
},
rgba函数设定颜色,红、绿、蓝、透明度,最大255,透明度最大1 地图可以在 highmaps地图列表 找到,其中的中国地图里省市都是拼音,把它下载下来全部替换为中文即可
全部代码如下
<html>
<head>
    <meta charset="utf-8">
    <title></title>
    <script src="https://code.jquery.com/jquery-3.1.1.min.js"></script>
    <script src="https://code.highcharts.com/maps/highmaps.js"></script>
    <script src="https://code.highcharts.com/mapdata/countries/cn/custom/cn-all-sar-taiwan.js"></script>
    <script src="http://cdnjs.cloudflare.com/ajax/libs/proj4js/2.2.2/proj4.js"></script>
    <style type="text/css">
        #container {
            height: 1000px;
            min-width: 800px;
            max-width: 1000px;
            margin: 0 auto;
        }

        .loading {
            margin-top: 10em;
            text-align: center;
            color: gray;
        }
    </style>

    <script type="text/javascript">
        $(function () {
            $('#container').highcharts('Map', {
                credits: {enabled: false},
                title: {text: '全国用户分布地图'},
                tooltip: {pointFormat: '纬度:{point.lat}<br>' + '经度:{point.lon}<br>'},
                series: [{
                    // 图层1 地图
                    mapData: Highcharts.maps['countries/cn/custom/cn-all-sar-taiwan'],
                    name: 'Basemap',
                    borderColor: '#A0A0A0',
                    nullColor: 'rgba(200, 200, 200, 0.3)',
                    showInLegend: false,
                    joinBy: 'hc-key',
                    dataLabels: { // 显示各个省份的名字
                        enabled: true,
                        color: 'rgba(0,0,0,0.3)',
                        format: '{point.name}',
                        zIndex: -1
                    }
                }, {
                    // 图层2 用户描点
                    type: "mappoint",
                    name: "用户",
                    marker: {
                        fillColor: 'rgba(256,0,0,0.1)', // 设置点的颜色,透明度是0.1
                        radius: 9, // 设置点大小
                    },
                    showInLegend: false,
                    data: [{
                        lat: 39.5427,
                        lon: 116.2317
                    }, {
                        lat: 39.4427,
                        lon: 114.2317
                    }, {
                        lat: 39.3427,
                        lon: 116.5317
                    }, {
                        lat: 39.2427,
                        lon: 116.2317
                    }, {
                        lat: 39.1427,
                        lon: 115.2317
                    }]
                }]
            });
        });
    </script>
</head>
<body>
<div id="container"></div>
</body>
</html>
来源:oschina
链接:https://my.oschina.net/u/780347/blog/779199