一、算法概述
(1)采用测量不同特征值之间的距离方法进行分类
- 优点: 精度高、对异常值不敏感、无数据输入假定。
- 缺点: 计算复杂度高、空间复杂度高。
(2)KNN模型的三个要素
kNN算法模型实际上就是对特征空间的的划分。模型有三个基本要素:距离度量、K值的选择和分类决策规则的决定。
-
距离度量
距离定义为:
Lp(xi,xj)=(∑l=1n|x(l)i−x(l)j|p)1pLp(xi,xj)=(∑l=1n|xi(l)−xj(l)|p)1p
一般使用欧式距离:p = 2的个情况Lp(xi,xj)=(∑l=1n|x(l)i−x(l)j|2)12Lp(xi,xj)=(∑l=1n|xi(l)−xj(l)|2)12 -
K值的选择
一般根据经验选择,需要多次选择对比才可以选择一个比较合适的K值。
如果K值太小,会导致模型太复杂,容易产生过拟合现象,并且对噪声点非常敏感。
如果K值太大,模型太过简单,忽略的大部分有用信息,也是不可取的。
-
分类决策规则
一般采用多数表决规则,通俗点说就是在这K个类别中,哪种类别最后就判别为哪种类型
二、实施kNN算法
2.1 伪代码
- 计算法已经类别数据集中的点与当前点之间的距离
- 按照距离递增次序排序
- 选取与但前点距离最小的k个点
- 确定前k个点所在类别的出现频率
- 返回前k个点出现频率最高的类别作为当前点的预测分类
2.2 实际代码
def classify0(inX, dataSet, labels, k):
    dataSetSize = dataSet.shape[0]
    diffMat = tile(inX, (dataSetSize,1)) - dataSet
    sqDiffMat = diffMat**2
    sqDistances = sqDiffMat.sum(axis=1)
    distances = sqDistances**0.5
    sortedDistIndicies = distances.argsort()
    classCount={}
    for i in range(k):
        voteIlabel = labels[sortedDistIndicies[i]]
        classCount[voteIlabel] = classCount.get(voteIlabel,0) + 1
    sortedClassCount = sorted(classCount.items(), key=operator.itemgetter(1), reverse=True)
    return sortedClassCount[0][0]
三、实际案例:使用kNN算法改进约会网站的配对效果
我的朋友阿J一直使用在线约会软件寻找约会对象,他曾经交往过三种类型的人:
- 不喜欢的人
- 感觉一般的人
- 非常喜欢的人
步骤:
- 收集数据
- 准备数据:也就是读取数据的过程
- 分析数据:使用Matplotlib画出二维散点图
- 训练算法
- 测试算法
- 使用算法
3.1 准备数据
样本数据共有1000个,3个特征值,共有4列数据,最后一列表示标签分类(0:不喜欢的人;1:感觉一般的人;2:非常喜欢的人)
特征
- 每年获得的飞行常客里程数
- 玩视频游戏所好的时间百分比
- 每周消费的冰淇淋公斤数
部分数据如下:
40920   8.326976    0.953952    3
14488   7.153469    1.673904    2
26052   1.441871    0.805124    1
75136   13.147394   0.428964    1
38344   1.669788    0.134296    1
72993   10.141740   1.032955    1
35948   6.830792    1.213192    3
42666   13.276369   0.543880    3
67497   8.631577    0.749278    1
35483   12.273169   1.508053    3
读取数据(读取txt文件)
def file2matrix(filename):
    fr = open(filename)
    numberOfLines = len(fr.readlines())         #get the number of lines in the file
    returnMat = zeros((numberOfLines,3))        #prepare matrix to return
    classLabelVector = []                       #prepare labels return
    fr = open(filename)
    index = 0
    for line in fr.readlines():
        line = line.strip()
        listFromLine = line.split('\t')
        returnMat[index,:] = listFromLine[0:3]
        classLabelVector.append(int(listFromLine[-1]))
        index += 1
    return returnMat,classLabelVector
3.2 分析数据:使用Matplotlib创建散点图
初步分析
import matplotlib
import matplotlib.pyplot as plt

plt.rcParams['font.sans-serif'] = ['Microsoft YaHei']

fig = plt.figure()
ax = fig.add_subplot(111)
ax.scatter(datingDataMat[:,1], datingDataMat[:,2])
ax.set_xlabel("玩视频游戏所耗时间百分比")
ax.set_ylabel("每周消费的冰淇淋公斤数")
plt.show()

因为有三种类型的分类,这样看的不直观,我们添加以下颜色
fig = plt.figure()
ax = fig.add_subplot(111)
ax.scatter(datingDataMat[:,1], datingDataMat[:,2])
ax.scatter(datingDataMat[:,1], datingDataMat[:,2], 15.0*array(datingLabels), 15.0*array(datingLabels))
ax.set_xlabel("玩视频游戏所耗时间百分比")
ax.set_ylabel("每周消费的冰淇淋公斤数")
plt.show()

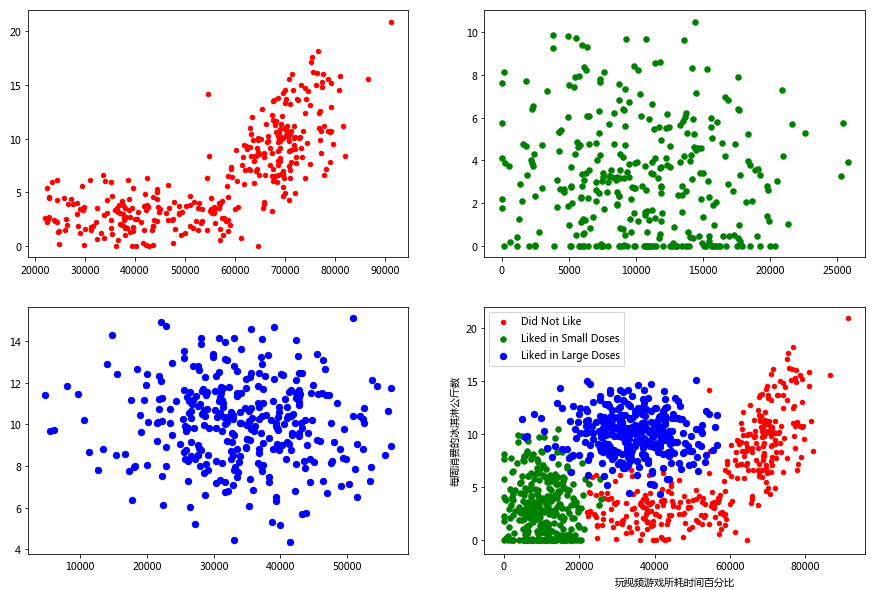
通过都多次的尝试后发现,玩游戏时间和冰淇淋这个两个特征关系比较明显
具体的步骤:
- 分别将标签为1,2,3的三种类型的数据分开
- 使用matplotlib绘制,并使用不同的颜色加以区分
datingDataType1 = array([[x[0][0],x[0][1],x[0][2]] for x in zip(datingDataMat,datingLabels) if x[1]==1])
datingDataType2 = array([[x[0][0],x[0][1],x[0][2]] for x in zip(datingDataMat,datingLabels) if x[1]==2])
datingDataType3 = array([[x[0][0],x[0][1],x[0][2]] for x in zip(datingDataMat,datingLabels) if x[1]==3])


fig, axs = plt.subplots(2, 2, figsize = (15,10))
axs[0,0].scatter(datingDataType1[:,0], datingDataType1[:,1], s = 20, c = 'red')
axs[0,1].scatter(datingDataType2[:,0], datingDataType2[:,1], s = 30, c = 'green')
axs[1,0].scatter(datingDataType3[:,0], datingDataType3[:,1], s = 40, c = 'blue')
type1 = axs[1,1].scatter(datingDataType1[:,0], datingDataType1[:,1], s = 20, c = 'red')
type2 = axs[1,1].scatter(datingDataType2[:,0], datingDataType2[:,1], s = 30, c = 'green')
type3 = axs[1,1].scatter(datingDataType3[:,0], datingDataType3[:,1], s = 40, c = 'blue')
axs[1,1].legend([type1, type2, type3], ["Did Not Like", "Liked in Small Doses", "Liked in Large Doses"], loc=2)
axs[1,1].set_xlabel("玩视频游戏所耗时间百分比")
axs[1,1].set_ylabel("每周消费的冰淇淋公斤数")

plt.show()

3.3 准备数据:数据归一化
通过上面的图形绘制,发现三个特征值的范围不一样,在使用KNN进行计算距离的时候,数值大的特征值就会对结果产生更大的影响。
数据归一化:就是将几组不同范围的数据,转换到同一个范围内。
公式: newValue = (oldValue - min)/(max - min)
def autoNorm(dataSet):
    minVals = dataSet.min(0) # array([[1,20,3], [4,5,60], [7,8,9]])   min(0) = [1, 5, 3]
    maxVals = dataSet.max(0)
    ranges = maxVals - minVals
    normData = zeros(shape(dataSet))
    m = dataSet.shape[0]
    normData = (dataSet - tile(minVals, (m,1)))/tile(ranges,(m,1))
    return normData
3.4 测试算法
我们将原始样本保留20%作为测试集,剩余80%作为训练集
def datingClassTest():
    hoRatio = 0.20
    datingDataMat,datingLabels = file2matrix('datingTestSet2.txt')       #load data setfrom file
    normMat = autoNorm(datingDataMat)
    m = normMat.shape[0]
    numTestVecs = int(m*hoRatio)
    errorCount = 0.0
    for i in range(numTestVecs):
        classifierResult = classify0(normMat[i,:],normMat[numTestVecs:,:],datingLabels[numTestVecs:],3)
        if (classifierResult != datingLabels[i]):
            errorCount += 1.0
    print ("the total error rate is: %f" % (errorCount/float(numTestVecs)))
    print (errorCount)
运行结果
the total error rate is: 0.080000
16.0
四、源代码
from numpy import *
import operator
from os import listdir

import matplotlib
import matplotlib.pyplot as plt

## KNN function
def classify0(inX, dataSet, labels, k):
    dataSetSize = dataSet.shape[0]
    diffMat = tile(inX, (dataSetSize,1)) - dataSet
    sqDiffMat = diffMat**2
    sqDistances = sqDiffMat.sum(axis=1)
    distances = sqDistances**0.5
    sortedDistIndicies = distances.argsort()
    classCount={}
    for i in range(k):
        voteIlabel = labels[sortedDistIndicies[i]]
        classCount[voteIlabel] = classCount.get(voteIlabel,0) + 1
    sortedClassCount = sorted(classCount.items(), key=operator.itemgetter(1), reverse=True)
    return sortedClassCount[0][0]

# read txt data
def file2matrix(filename):
    fr = open(filename)
    numberOfLines = len(fr.readlines())         #get the number of lines in the file
    returnMat = zeros((numberOfLines,3))        #prepare matrix to return
    classLabelVector = []                       #prepare labels return
    fr = open(filename)
    index = 0
    for line in fr.readlines():
        line = line.strip()
        listFromLine = line.split('\t')
        returnMat[index,:] = listFromLine[0:3]
        classLabelVector.append(int(listFromLine[-1]))
        index += 1
    return returnMat,classLabelVector


def autoNorm(dataSet):
    minVals = dataSet.min(0) # array([[1,20,3], [4,5,60], [7,8,9]])   min(0) = [1, 5, 3]
    maxVals = dataSet.max(0)
    ranges = maxVals - minVals
    normData = zeros(shape(dataSet))
    m = dataSet.shape[0]
    normData = (dataSet - tile(minVals, (m,1)))/tile(ranges,(m,1))
    return normData


def drawScatter1(datingDataMat, datingLabels):
    plt.rcParams['font.sans-serif'] = ['Microsoft YaHei']

    fig = plt.figure()
    ax = fig.add_subplot(111)
    ax.scatter(datingDataMat[:,1], datingDataMat[:,2])
    ax.set_xlabel("玩视频游戏所耗时间百分比")
    ax.set_ylabel("每周消费的冰淇淋公斤数")
    plt.show()

def drawScatter2(datingDataMat, datingLabels):
    fig = plt.figure()
    ax = fig.add_subplot(111)
    ax.scatter(datingDataMat[:,1], datingDataMat[:,2])
    ax.scatter(datingDataMat[:,1], datingDataMat[:,2], 15.0*array(datingLabels), 15.0*array(datingLabels))
    ax.set_xlabel("玩视频游戏所耗时间百分比")
    ax.set_ylabel("每周消费的冰淇淋公斤数")
    plt.show()


def drawScatter3(datingDataMat, datingLabels):
    datingDataType1 = array([[x[0][0],x[0][1],x[0][2]] for x in zip(datingDataMat,datingLabels) if x[1]==1])
    datingDataType2 = array([[x[0][0],x[0][1],x[0][2]] for x in zip(datingDataMat,datingLabels) if x[1]==2])
    datingDataType3 = array([[x[0][0],x[0][1],x[0][2]] for x in zip(datingDataMat,datingLabels) if x[1]==3])

    fig, axs = plt.subplots(2, 2, figsize = (15,10))
    axs[0,0].scatter(datingDataType1[:,0], datingDataType1[:,1], s = 20, c = 'red')
    axs[0,1].scatter(datingDataType2[:,0], datingDataType2[:,1], s = 30, c = 'green')
    axs[1,0].scatter(datingDataType3[:,0], datingDataType3[:,1], s = 40, c = 'blue')
    type1 = axs[1,1].scatter(datingDataType1[:,0], datingDataType1[:,1], s = 20, c = 'red')
    type2 = axs[1,1].scatter(datingDataType2[:,0], datingDataType2[:,1], s = 30, c = 'green')
    type3 = axs[1,1].scatter(datingDataType3[:,0], datingDataType3[:,1], s = 40, c = 'blue')
    axs[1,1].legend([type1, type2, type3], ["Did Not Like", "Liked in Small Doses", "Liked in Large Doses"], loc=2)
    axs[1,1].set_xlabel("玩视频游戏所耗时间百分比")
    axs[1,1].set_ylabel("每周消费的冰淇淋公斤数")

    plt.show()


def datingClassTest():
    hoRatio = 0.20
    datingDataMat,datingLabels = file2matrix('datingTestSet2.txt')       #load data setfrom file
    normMat = autoNorm(datingDataMat)
    m = normMat.shape[0]
    numTestVecs = int(m*hoRatio)
    errorCount = 0.0
    for i in range(numTestVecs):
        classifierResult = classify0(normMat[i,:],normMat[numTestVecs:,:],datingLabels[numTestVecs:],3)
        if (classifierResult != datingLabels[i]):
            errorCount += 1.0
    print ("the total error rate is: %f" % (errorCount/float(numTestVecs)))
    print (errorCount)


datingDataMat, datingLabels = file2matrix("datingTestSet2.txt")

drawScatter1(datingDataMat, datingLabels)
drawScatter2(datingDataMat, datingLabels)
drawScatter3(datingDataMat, datingLabels)

datingClassTest()
http://www.wu0553.com/news/61956.html
http://www.wu0553.com/news/61953.html
http://www.wu0553.com/news/61951.html
http://www.wu0553.com/news/61947.html
http://www.wu0553.com/news/61944.html
http://www.wu0553.com/news/61940.html
http://www.wu0553.com/news/61937.html
http://www.wu0553.com/news/61935.html
http://www.wu0553.com/news/61933.html
http://www.wu0553.com/news/61932.html
http://www.wu0553.com/news/61931.html
http://www.wu0553.com/news/61929.html
http://www.wu0553.com/news/61928.html
http://www.wu0553.com/news/61926.html
http://www.wu0553.com/news/61925.html
http://www.wu0553.com/m/view.php?aid=61947
http://www.wu0553.com/m/view.php?aid=61944
http://www.wu0553.com/m/view.php?aid=61940
http://www.wu0553.com/m/view.php?aid=61937
http://www.wu0553.com/m/view.php?aid=61935
http://www.wu0553.com/m/view.php?aid=61933
http://www.wu0553.com/m/view.php?aid=61932
http://www.wu0553.com/m/view.php?aid=61931
http://www.wu0553.com/m/view.php?aid=61929
http://www.wu0553.com/m/view.php?aid=61928
http://www.wu0553.com/m/view.php?aid=61926
http://www.wu0553.com/m/view.php?aid=61925
http://market.szonline.net/amaz/26222.html
http://market.szonline.net/amaz/26221.html
http://market.szonline.net/amaz/26220.html
http://market.szonline.net/amaz/26219.html
http://market.szonline.net/amaz/26217.html
http://market.szonline.net/amaz/26214.html
http://market.szonline.net/amaz/26210.html
http://market.szonline.net/amaz/26207.html
http://market.szonline.net/amaz/26204.html
http://market.szonline.net/amaz/26201.html
http://market.szonline.net/amaz/26198.html
http://market.szonline.net/amaz/26195.html
http://market.szonline.net/amaz/26192.html
http://market.szonline.net/amaz/26189.html
http://market.szonline.net/amaz/26185.html
http://market.szonline.net/amaz/26182.html
http://market.szonline.net/amaz/26179.html
http://market.szonline.net/amaz/26177.html
http://market.szonline.net/amaz/26176.html
http://market.szonline.net/amaz/26175.html
http://market.szonline.net/amaz/26174.html
http://market.szonline.net/amaz/26173.html
http://market.szonline.net/amaz/26172.html
http://market.szonline.net/amaz/26171.html
http://market.szonline.net/amaz/26170.html
http://market.szonline.net/amaz/26169.html
http://market.szonline.net/amaz/26168.html
http://market.szonline.net/amaz/26167.html