摘自: https://www.kesci.com/home/project/5ecd20d0c1a73900361b92b5
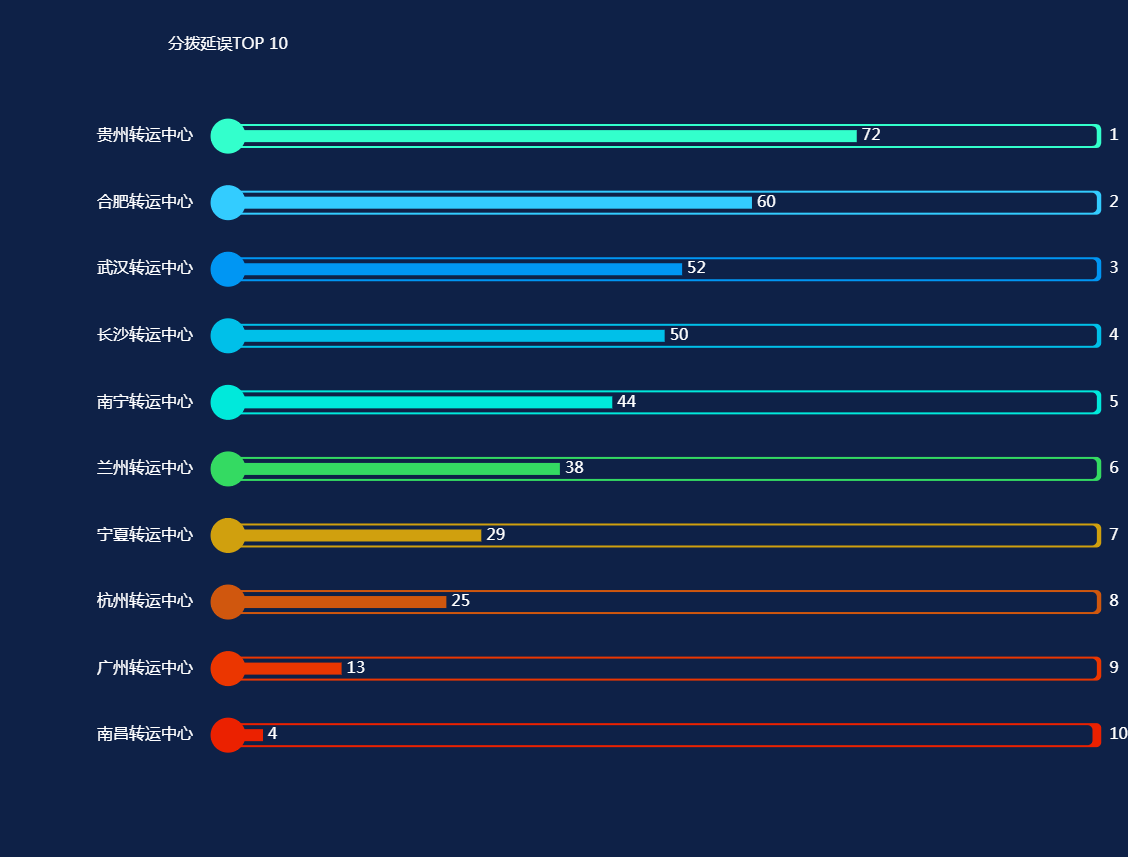
var myColor = ['#eb2100', '#eb3600', '#d0570e', '#d0a00e', '#34da62', '#00e9db', '#00c0e9', '#0096f3', '#33CCFF', '#33FFCC'];
option = {
    backgroundColor: '#0e2147',
    grid: {
        left: '11%',
        top: '12%',
        right: '0%',
        bottom: '8%',
        containLabel: true
    },
    xAxis: [{
        show: false,
    }],
    yAxis: [{
        axisTick: 'none',
        axisLine: 'none',
        offset: '27',
        axisLabel: {
            textStyle: {
                color: '#ffffff',
                fontSize: '16',
            }
        },
        data: ['南昌转运中心', '广州转运中心', '杭州转运中心', '宁夏转运中心', '兰州转运中心', '南宁转运中心', '长沙转运中心', '武汉转运中心', '合肥转运中心', '贵州转运中心']
    }, {
        axisTick: 'none',
        axisLine: 'none',
        axisLabel: {
            textStyle: {
                color: '#ffffff',
                fontSize: '16',
            }
        },
        data: ['10', '9', '8', '7', '6', '5', '4', '3', '2', '1']
    }, {
        name: '分拨延误TOP 10',
        nameGap: '50',
        nameTextStyle: {
            color: '#ffffff',
            fontSize: '16',
        },
        axisLine: {
            lineStyle: {
                color: 'rgba(0,0,0,0)'
            }
        },
        data: [],
    }],
    series: [{
            name: '条',
            type: 'bar',
            yAxisIndex: 0,
            data: [4, 13, 25, 29, 38, 44, 50, 52, 60, 72],
            label: {
                normal: {
                    show: true,
                    position: 'right',
                    textStyle: {
                        color: '#ffffff',
                        fontSize: '16',
                    }
                }
            },
            barWidth: 12,
            itemStyle: {
                normal: {
                    color: function(params) {
                        var num = myColor.length;
                        return myColor[params.dataIndex % num]
                    },
                }
            },
            z: 2
        }, {
            name: '白框',
            type: 'bar',
            yAxisIndex: 1,
            barGap: '-100%',
            data: [99, 99.5, 99.5, 99.5, 99.5, 99.5, 99.5, 99.5, 99.5, 99.5],
            barWidth: 20,
            itemStyle: {
                normal: {
                    color: '#0e2147',
                    barBorderRadius: 5,
                }
            },
            z: 1
        }, {
            name: '外框',
            type: 'bar',
            yAxisIndex: 2,
            barGap: '-100%',
            data: [100, 100, 100, 100, 100, 100, 100, 100, 100, 100],
            barWidth: 24,
            itemStyle: {
                normal: {
                    color: function(params) {
                        var num = myColor.length;
                        return myColor[params.dataIndex % num]
                    },
                    barBorderRadius: 5,
                }
            },
            z: 0
        },
        {
            name: '外圆',
            type: 'scatter',
            hoverAnimation: false,
            data: [0, 0, 0, 0, 0, 0, 0, 0, 0, 0],
            yAxisIndex: 2,
            symbolSize: 35,
            itemStyle: {
                normal: {
                    color: function(params) {
                        var num = myColor.length;
                        return myColor[params.dataIndex % num]
                    },
                    opacity: 1,
                }
            },
            z: 2
        }
    ]
};
渲染效果:

来源:https://gallery.echartsjs.com/editor.html?c=xhmv-1o6XS
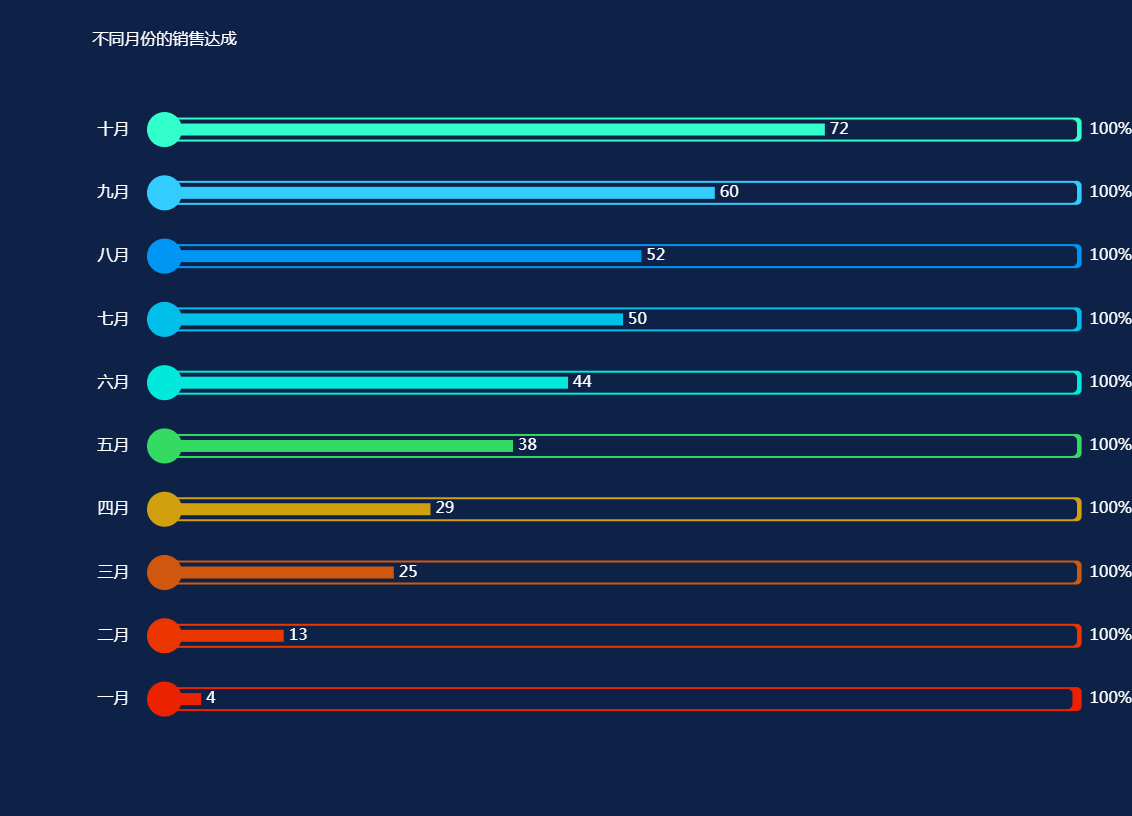
var myColor = ['#eb2100', '#eb3600', '#d0570e', '#d0a00e', '#34da62', '#00e9db', '#00c0e9', '#0096f3', '#33CCFF', '#33FFCC'];
option = {
    backgroundColor: '#0e2147',
    grid: {
        left: '11%',
        top: '12%',
        right: '0%',
        bottom: '8%',
        containLabel: true
    },
    xAxis: [{
        show: false,
    }],
    yAxis: [{
        axisTick: 'none',
        axisLine: 'none',
        offset: '27',
        axisLabel: {
            textStyle: {
                color: '#ffffff',
                fontSize: '16',
            }
        },
        data: ['一月', '二月', '三月', '四月', '五月', '六月', '七月', '八月', '九月', '十月']
    }, {
        axisTick: 'none',
        axisLine: 'none',
        axisLabel: {
            textStyle: {
                color: '#ffffff',
                fontSize: '16',
            }
        },
        data: ['100%', '100%', '100%', '100%', '100%', '100%', '100%', '100%', '100%', '100%']
    }, {
        name: '不同月份的销售达成',
        nameGap: '50',
        nameTextStyle: {
            color: '#ffffff',
            fontSize: '16',
        },
        axisLine: {
            lineStyle: {
                color: 'rgba(0,0,0,0)'
            }
        },
        data: [],
    }],
    series: [{
            name: '条',
            type: 'bar',
            yAxisIndex: 0,
            data: [4, 13, 25, 29, 38, 44, 50, 52, 60, 72],
            label: {
                normal: {
                    show: true,
                    position: 'right',
                    textStyle: {
                        color: '#ffffff',
                        fontSize: '16',
                    }
                }
            },
            barWidth: 12,
            itemStyle: {
                normal: {
                    color: function(params) {
                        var num = myColor.length;
                        return myColor[params.dataIndex % num]
                    },
                }
            },
            z: 2
        }, {
            name: '白框',
            type: 'bar',
            yAxisIndex: 1,
            barGap: '-100%',
            data: [99, 99.5, 99.5, 99.5, 99.5, 99.5, 99.5, 99.5, 99.5, 99.5],
            barWidth: 20,
            itemStyle: {
                normal: {
                    color: '#0e2147',
                    barBorderRadius: 5,
                }
            },
            z: 1
        }, {
            name: '外框',
            type: 'bar',
            yAxisIndex: 2,
            barGap: '-100%',
            data: [100, 100, 100, 100, 100, 100, 100, 100, 100, 100],
            barWidth: 24,
            itemStyle: {
                normal: {
                    color: function(params) {
                        var num = myColor.length;
                        return myColor[params.dataIndex % num]
                    },
                    barBorderRadius: 5,
                }
            },
            z: 0
        },
        {
            name: '外圆',
            type: 'scatter',
            hoverAnimation: false,
            data: [0, 0, 0, 0, 0, 0, 0, 0, 0, 0],
            yAxisIndex: 2,
            symbolSize: 35,
            itemStyle: {
                normal: {
                    color: function(params) {
                        var num = myColor.length;
                        return myColor[params.dataIndex % num]
                    },
                    opacity: 1,
                }
            },
            z: 2
        }
    ]
};
渲染效果:

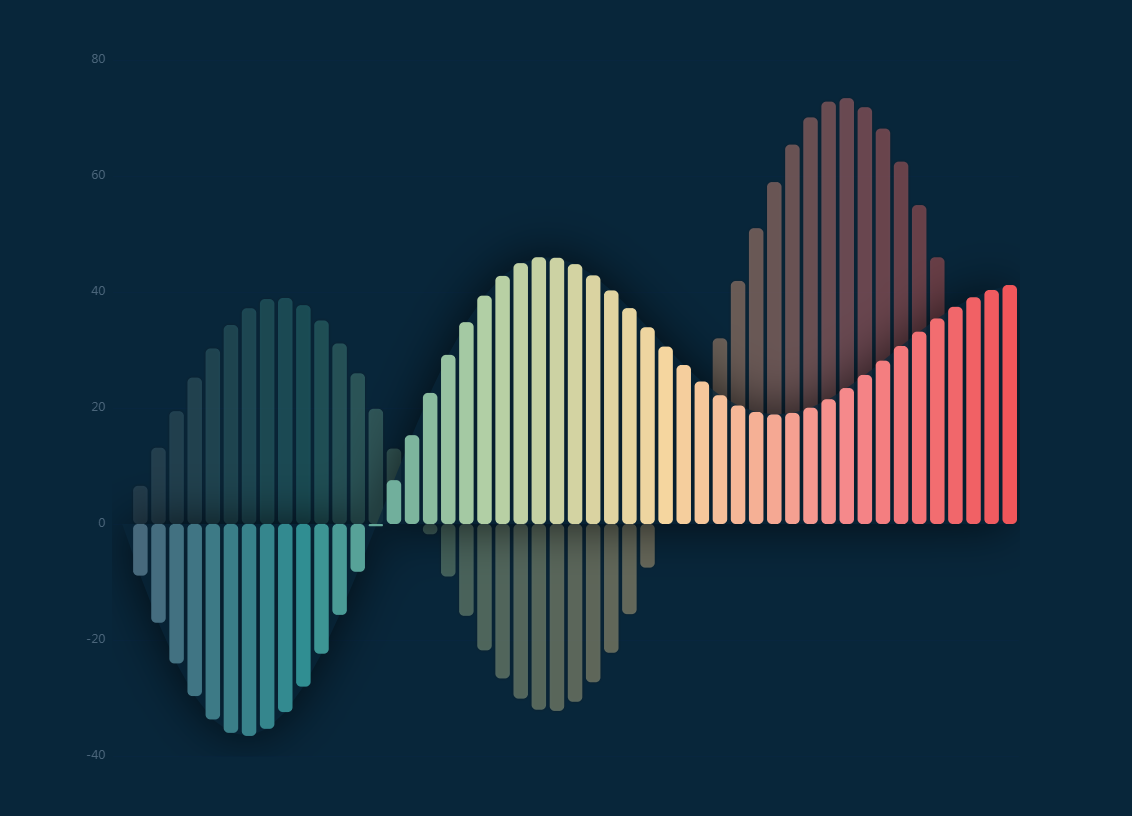
琴键图表:
var xAxisData = [];
var data = [];
var data2 = [];
for (var i = 0; i < 50; i++) {
    xAxisData.push(i);
    data.push((Math.sin(i / 5) * (i / 5 -10) + i / 6) * 5);
    data2.push((Math.sin(i / 5) * (i / 5 + 10) + i / 6) * 3);
}

option = {
    backgroundColor: '#08263a',
    xAxis: [{
        show: false,
        data: xAxisData
    }, {
        show: false,
        data: xAxisData
    }],
    visualMap: {
        show: false,
        min: 0,
        max: 50,
        dimension: 0,
        inRange: {
            color: ['#4a657a', '#308e92', '#b1cfa5', '#f5d69f', '#f5898b', '#ef5055']
        }
    },
    yAxis: {
        axisLine: {
            show: false
        },
        axisLabel: {
            textStyle: {
                color: '#4a657a'
            }
        },
        splitLine: {
            show: true,
            lineStyle: {
                color: '#08263f'
            }
        },
        axisTick: {
            show: false
        }
    },
    series: [{
        name: 'back',
        type: 'bar',
        data: data2,
        z: 1,
        itemStyle: {
            normal: {
                opacity: 0.4,
                barBorderRadius: 5,
                shadowBlur: 3,
                shadowColor: '#111'
            }
        }
    }, {
        name: 'Simulate Shadow',
        type: 'line',
        data: data,
        z: 2,
        showSymbol: false,
        animationDelay: 0,
        animationEasing: 'linear',
        animationDuration: 1200,
        lineStyle: {
            normal: {
                color: 'transparent'
            }
        },
        areaStyle: {
            normal: {
                color: '#08263a',
                shadowBlur: 50,
                shadowColor: '#000'
            }
        }
    }, {
        name: 'front',
        type: 'bar',
        data: data,
        xAxisIndex: 1,
        z: 3,
        itemStyle: {
            normal: {
                barBorderRadius: 5
            }
        }
    }],
    animationEasing: 'elasticOut',
    animationEasingUpdate: 'elasticOut',
    animationDelay: function (idx) {
        return idx * 20;
    },
    animationDelayUpdate: function (idx) {
        return idx * 20;
    }
};
渲染效果:

来源: https://gallery.echartsjs.com/editor.html?c=xByHHV40b
$.get(ROOT_PATH + '/data/asset/data/lines-bus.json', function(data) {
    var hStep = 300 / (data.length - 1);
    var busLines = [].concat.apply([], data.map(function (busLine, idx) {
        var prevPt;
        var points = [];
        for (var i = 0; i < busLine.length; i += 2) {
            var pt = [busLine[i], busLine[i + 1]];
            if (i > 0) {
                pt = [
                    prevPt[0] + pt[0],
                    prevPt[1] + pt[1]
                ];
            }
            prevPt = pt;

            points.push([pt[0] / 1e4, pt[1] / 1e4]);
        }
        return {
            coords: points,
            lineStyle: {
                normal: {
                    color: echarts.color.modifyHSL('#5A94DF', Math.round(hStep * idx))
                }
            }
        };
    }));
    myChart.setOption(option = {
        bmap: {
            center: [116.46, 39.92],
            zoom: 10,
            roam: true,
            mapStyle: {
              'styleJson': [
                {
                  'featureType': 'water',
                  'elementType': 'all',
                  'stylers': {
                    'color': '#031628'
                  }
                },
                {
                  'featureType': 'land',
                  'elementType': 'geometry',
                  'stylers': {
                    'color': '#000102'
                  }
                },
                {
                  'featureType': 'highway',
                  'elementType': 'all',
                  'stylers': {
                    'visibility': 'off'
                  }
                },
                {
                  'featureType': 'arterial',
                  'elementType': 'geometry.fill',
                  'stylers': {
                    'color': '#000000'
                  }
                },
                {
                  'featureType': 'arterial',
                  'elementType': 'geometry.stroke',
                  'stylers': {
                    'color': '#0b3d51'
                  }
                },
                {
                  'featureType': 'local',
                  'elementType': 'geometry',
                  'stylers': {
                    'color': '#000000'
                  }
                },
                {
                  'featureType': 'railway',
                  'elementType': 'geometry.fill',
                  'stylers': {
                    'color': '#000000'
                  }
                },
                {
                  'featureType': 'railway',
                  'elementType': 'geometry.stroke',
                  'stylers': {
                    'color': '#08304b'
                  }
                },
                {
                  'featureType': 'subway',
                  'elementType': 'geometry',
                  'stylers': {
                    'lightness': -70
                  }
                },
                {
                  'featureType': 'building',
                  'elementType': 'geometry.fill',
                  'stylers': {
                    'color': '#000000'
                  }
                },
                {
                  'featureType': 'all',
                  'elementType': 'labels.text.fill',
                  'stylers': {
                    'color': '#857f7f'
                  }
                },
                {
                  'featureType': 'all',
                  'elementType': 'labels.text.stroke',
                  'stylers': {
                    'color': '#000000'
                  }
                },
                {
                  'featureType': 'building',
                  'elementType': 'geometry',
                  'stylers': {
                    'color': '#022338'
                  }
                },
                {
                  'featureType': 'green',
                  'elementType': 'geometry',
                  'stylers': {
                    'color': '#062032'
                  }
                },
                {
                  'featureType': 'boundary',
                  'elementType': 'all',
                  'stylers': {
                    'color': '#465b6c'
                  }
                },
                {
                  'featureType': 'manmade',
                  'elementType': 'all',
                  'stylers': {
                    'color': '#022338'
                  }
                },
                {
                  'featureType': 'label',
                  'elementType': 'all',
                  'stylers': {
                    'visibility': 'off'
                  }
                }
              ]
            }
        },
        series: [{
            type: 'lines',
            coordinateSystem: 'bmap',
            polyline: true,
            data: busLines,
            silent: true,
            lineStyle: {
                // color: '#c23531',
                // color: 'rgb(200, 35, 45)',
                opacity: 0.2,
                width: 1
            },
            progressiveThreshold: 500,
            progressive: 200
        }, {
            type: 'lines',
            coordinateSystem: 'bmap',
            polyline: true,
            data: busLines,
            lineStyle: {
                width: 0
            },
            effect: {
                constantSpeed: 20,
                show: true,
                trailLength: 0.1,
                symbolSize: 1.5
            },
            zlevel: 1
        }]
    });
});
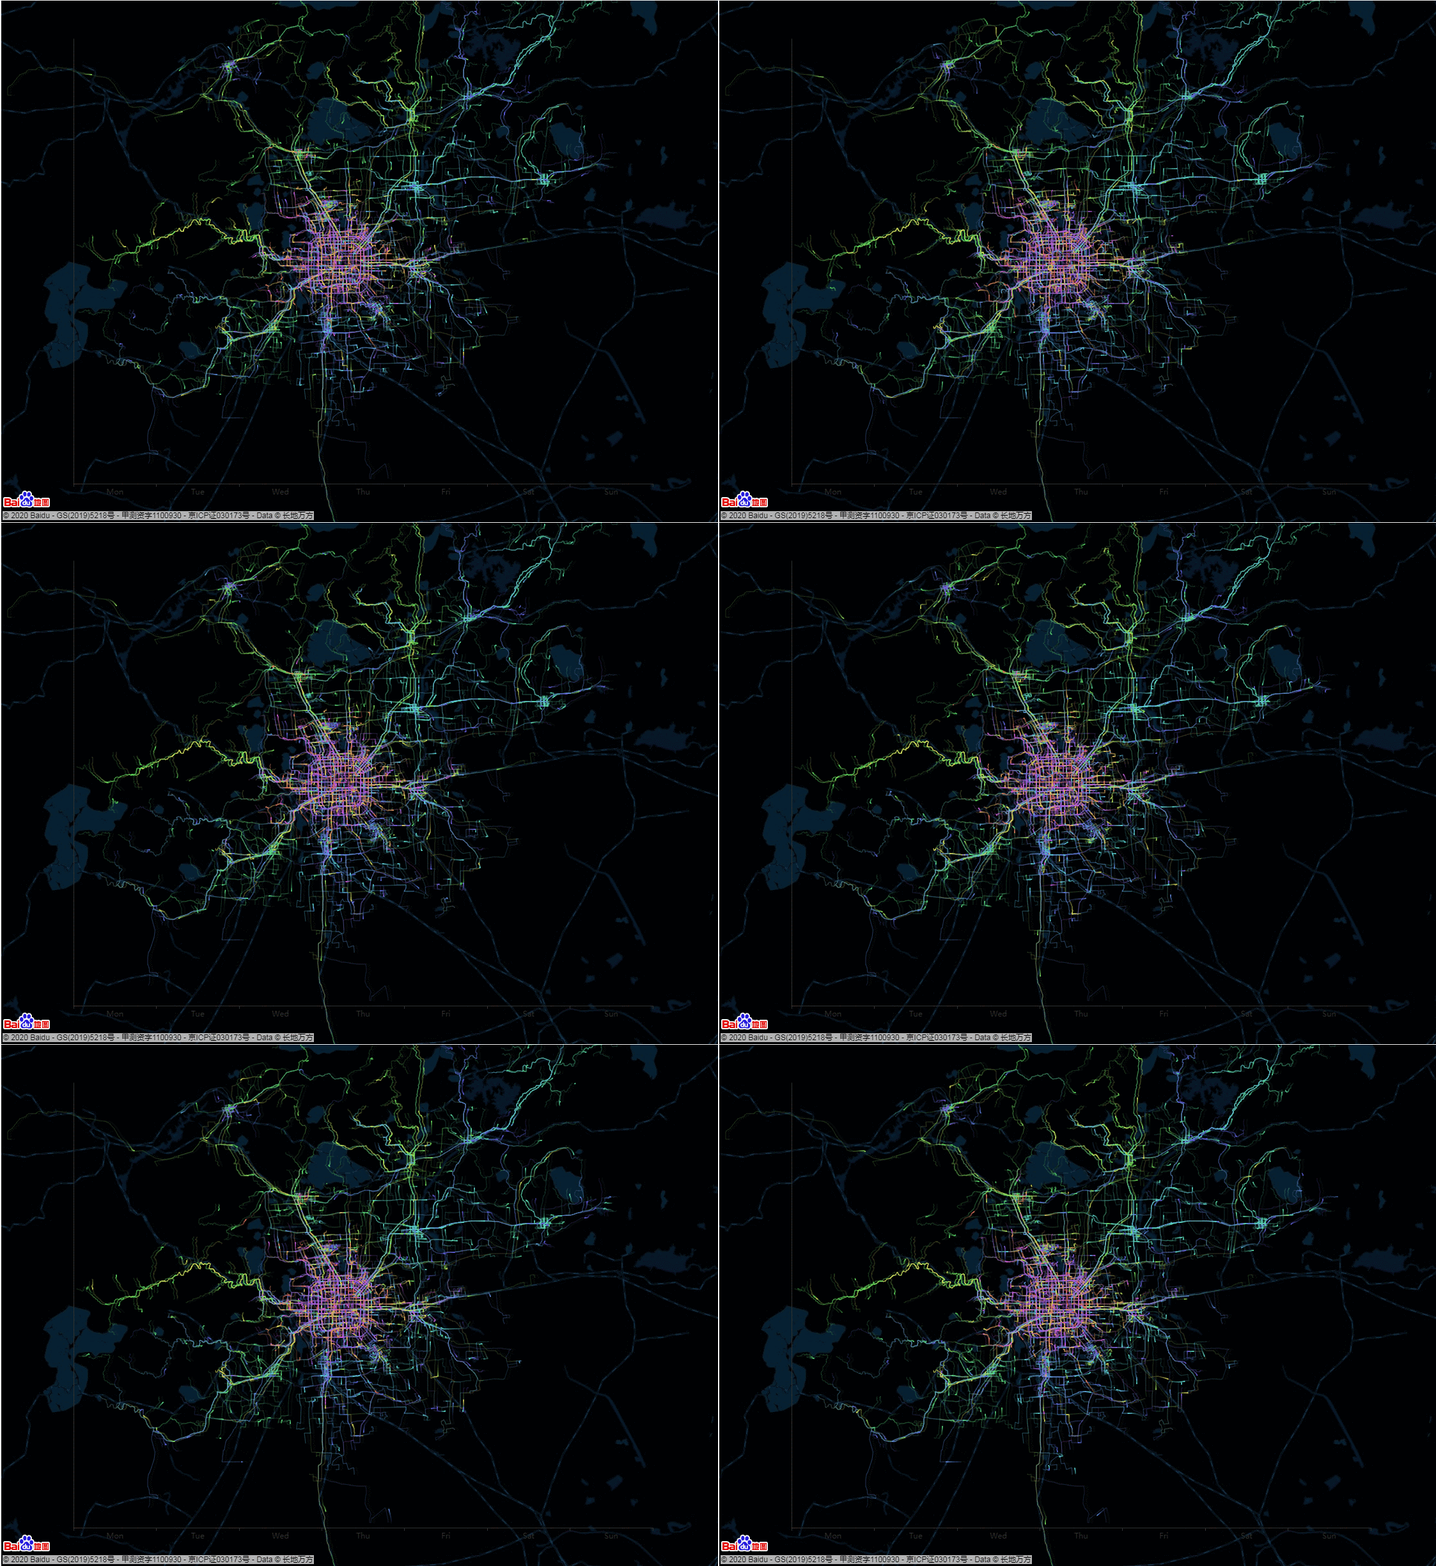
渲染效果:

来源:https://echarts.apache.org/examples/zh/editor.html?c=lines-bmap-effect
来源:oschina
链接:https://my.oschina.net/u/3750423/blog/4492916