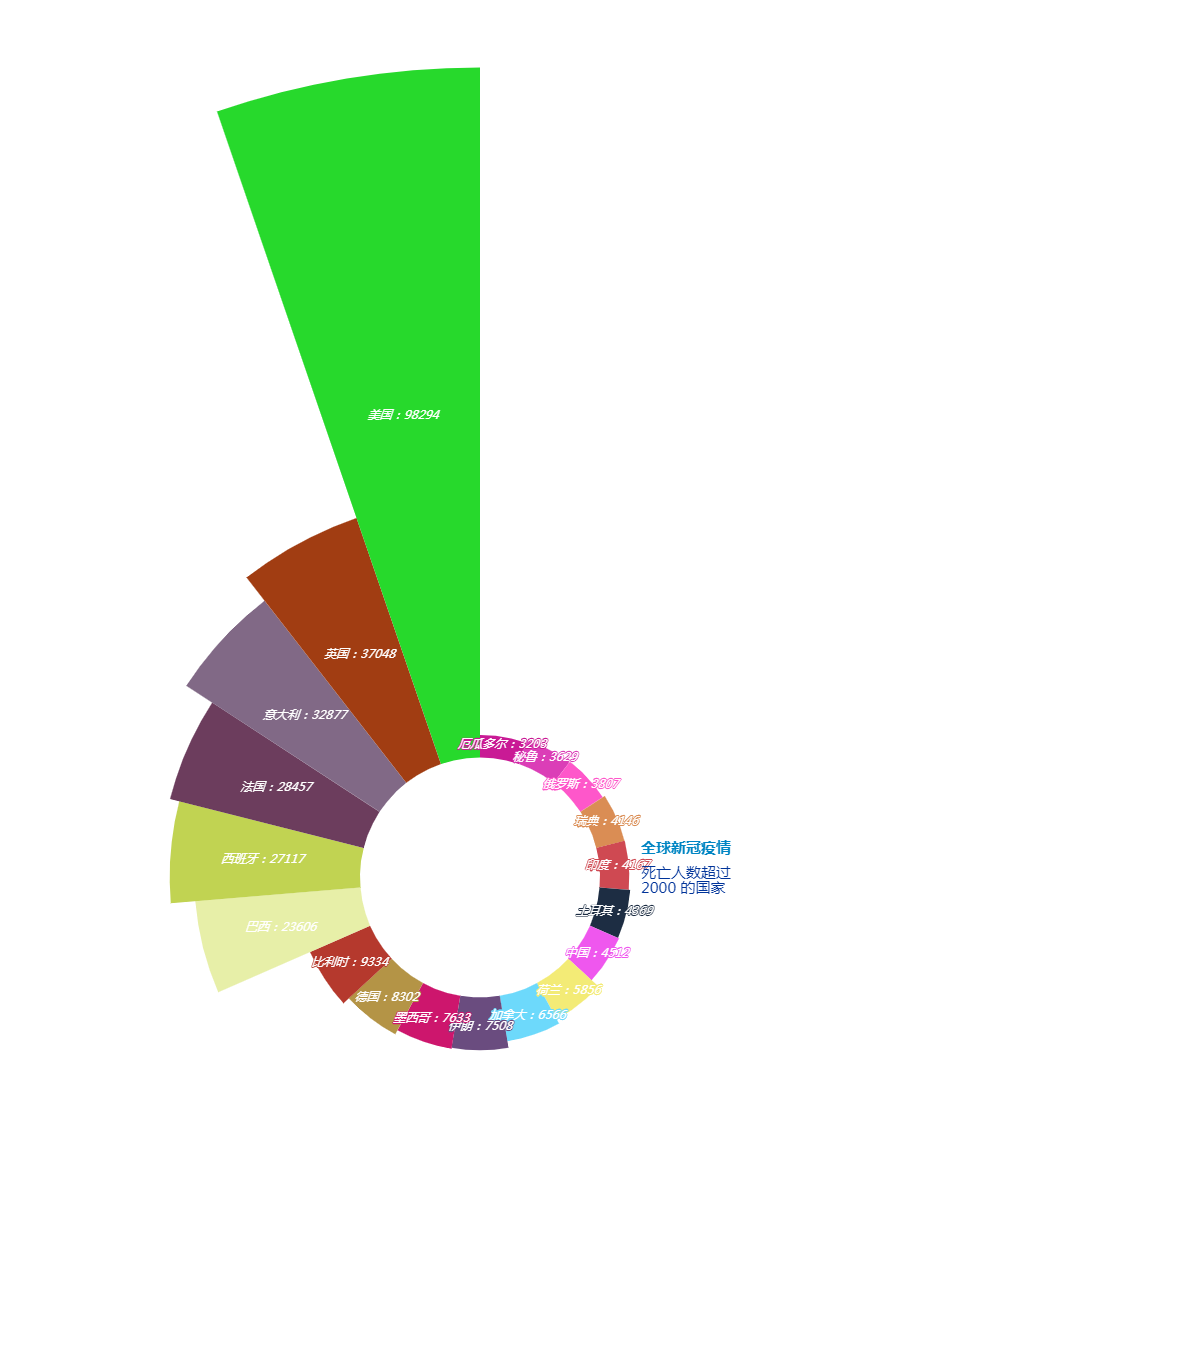
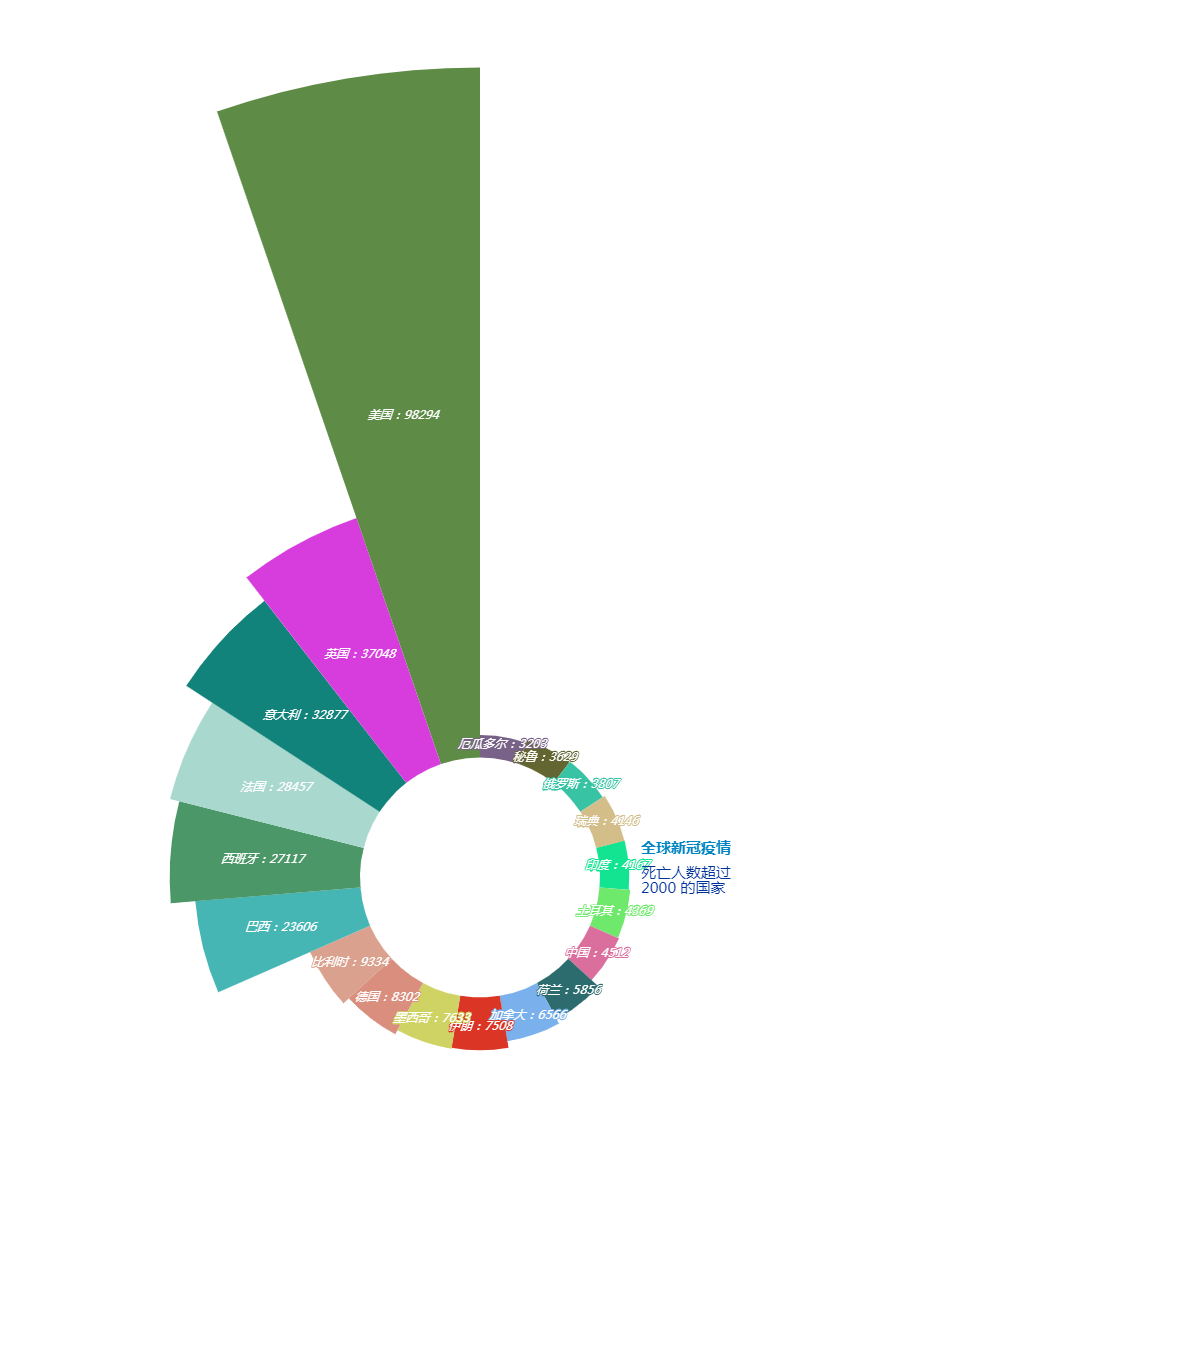
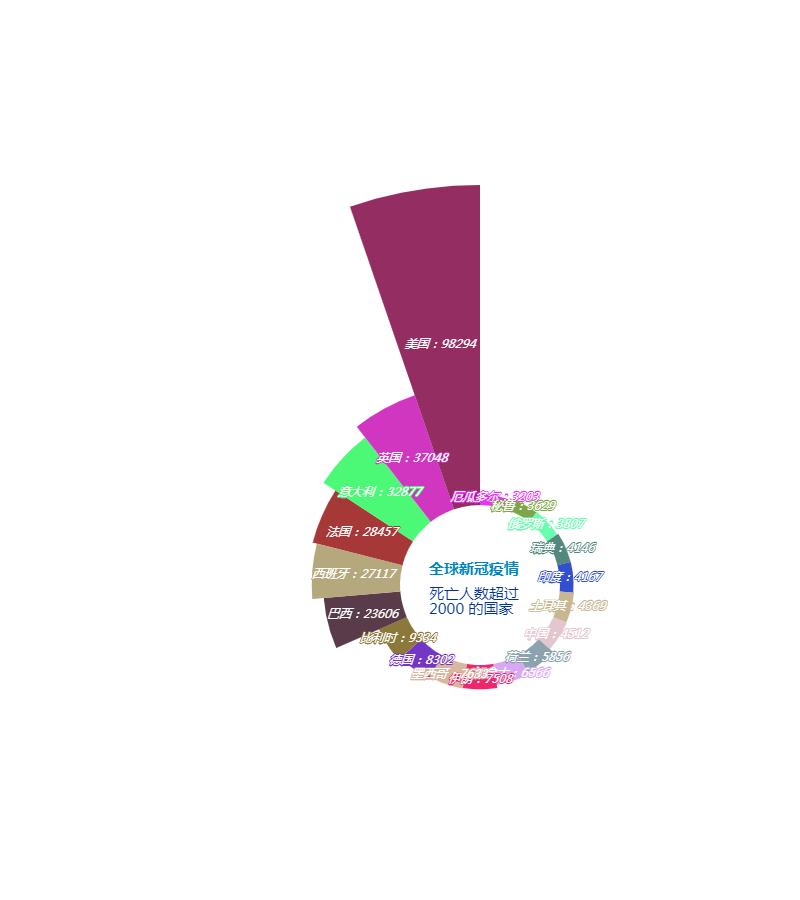
我凌晨用Python爬虫实时从网上爬取各国在疫情中仙去人数的数据,然后仿人民日报制作成“南丁格尔玫瑰图”
英国37048;意大利32877;西班牙27117都对得上;
但美国、法国、巴西的跟百度大数据的对比,存在些许误差。
可能是不同网站的数据源的更新不同步造成的吧?
——2020年5月27日3时18分前
数据源通过接口 `https://lab.isaaclin.cn/nCoV/zh` 来抓取,我们取疫情中死亡人数超过 2000 的国家的数据 。
代码如下:
from pyecharts.charts import Pie
from pyecharts import options as opts
import random, requests

url = 'https://lab.isaaclin.cn/nCoV/api/area'
data_json = requests.get(url).json()
country_list = []
count_list = []
ds = {}
for item in data_json['results']:
    if item['countryEnglishName']:
        if item['deadCount'] is not None and item['countryName'] is not None:
            if int(item['deadCount']) > 2000:
                d = {item['countryName']:item['deadCount']}
                ds.update(d)
ds = dict(sorted(ds.items(), key = lambda k: k[1]))
# 名称有重复的,把国家名作为 key 吧
country_list = ds.keys()
count_list = ds.values()
# 随机颜色生成
def randomcolor(kind):
    colors = []
    for i in range(kind):
        colArr = ['1', '2', '3', '4', '5', '6', '7', '8', '9', 'A', 'B', 'C', 'D', 'E', 'F']
        color = ""
        for i in range(6):
            color += colArr[random.randint(0, 14)]
        colors.append("#" + color)
    return colors
color_series = randomcolor(len(count_list))
# 创建饼图
pie = Pie(init_opts=opts.InitOpts(width='1200px', height='1350px'))
# 添加数据
pie.add("", [list(z) for z in zip(country_list, count_list)],
        radius=['20%', '135%'],
        center=['40%', '65%'],
        rosetype='area')
# 设置全局配置
# pie.set_global_opts(title_opts=opts.TitleOpts(title='南丁格尔玫瑰图'),
#                     legend_opts=opts.LegendOpts(is_show=False))
# 设置全局配置项
pie.set_global_opts(title_opts=opts.TitleOpts(title='全球新冠疫情',subtitle='死亡人数超过n2000 的国家',
                                               title_textstyle_opts=opts.TextStyleOpts(font_size=15,color= '#0085c3'),
                                               subtitle_textstyle_opts= opts.TextStyleOpts(font_size=15,color= '#003399'),
                                               pos_right= 'center',pos_left= '53%',pos_top= '62%',pos_bottom='center'
                                              ),
                     legend_opts=opts.LegendOpts(is_show=False))
# 设置系列配置和颜色
pie.set_series_opts(label_opts=opts.LabelOpts(is_show=True, position='inside', font_size=12,
                                              formatter='{b}:{c}', font_style='italic',
                                              font_family='Microsoft YaHei'))
pie.set_colors(color_series)
# pie.render('南丁格尔玫瑰图.html')
pie.render_notebook()


from pyecharts.charts import Pie
from pyecharts import options as opts
import random, requests

url = 'https://lab.isaaclin.cn/nCoV/api/area'
data_json = requests.get(url).json()
country_list = []
count_list = []
ds = {}
for item in data_json['results']:
    if item['countryEnglishName']:
        if item['deadCount'] is not None and item['countryName'] is not None:
            if int(item['deadCount']) > 2000:
                d = {item['countryName']:item['deadCount']}
                ds.update(d)
ds = dict(sorted(ds.items(), key = lambda k: k[1]))
# 名称有重复的,把国家名作为 key 吧
country_list = ds.keys()
count_list = ds.values()
# 随机颜色生成
def randomcolor(kind):
    colors = []
    for i in range(kind):
        colArr = ['1', '2', '3', '4', '5', '6', '7', '8', '9', 'A', 'B', 'C', 'D', 'E', 'F']
        color = ""
        for i in range(6):
            color += colArr[random.randint(0, 14)]
        colors.append("#" + color)
    return colors
color_series = randomcolor(len(count_list))
# 创建饼图
pie = Pie(init_opts=opts.InitOpts(width='800px', height='900px'))
# 添加数据
pie.add("", [list(z) for z in zip(country_list, count_list)],
        radius=['20%', '100%'],
        center=['60%', '65%'],
        rosetype='area')
# 设置全局配置
# pie.set_global_opts(title_opts=opts.TitleOpts(title='南丁格尔玫瑰图'),
#                     legend_opts=opts.LegendOpts(is_show=False))
# 设置全局配置项
pie.set_global_opts(title_opts=opts.TitleOpts(title='全球新冠疫情',subtitle='死亡人数超过n2000 的国家',
                                               title_textstyle_opts=opts.TextStyleOpts(font_size=15,color= '#0085c3'),
                                               subtitle_textstyle_opts= opts.TextStyleOpts(font_size=15,color= '#003399'),
                                               pos_right= 'center',pos_left= '53%',pos_top= '62%',pos_bottom='center'
                                              ),
                     legend_opts=opts.LegendOpts(is_show=False))
# 设置系列配置和颜色
pie.set_series_opts(label_opts=opts.LabelOpts(is_show=True, position='inside', font_size=12,
                                              formatter='{b}:{c}', font_style='italic',
                                              font_family='Microsoft YaHei'))
pie.set_colors(color_series)
# pie.render('南丁格尔玫瑰图.html')
pie.render_notebook()

来源:oschina
链接:https://my.oschina.net/u/3750423/blog/4291963