【推荐】2019 Java 开发者跳槽指南.pdf(吐血整理) >>> 
Grafana
Grafana 是开源的,功能齐全的度量仪表盘和图形编辑器,支持 Graphite,OpenTSDB,Elasticsearch,Cloudwatch,Prometheus,InfluxDB,小米监控
等。
安装
分别安装grafana、prometheus、blackbox_exporter,安装文档参考官网。
配置
prometheus 配置和运行
在prometheus的配置文件 prometheus.yml 中增加一个新的job
  - job_name: 'ping_all'
    scrape_interval: 5s
    metrics_path: /probe
    params:
      module: [icmp]  #ping
    static_configs:
      - targets: ['114.114.114.114', '8.8.8.8']
        labels:
          group: '一线城市-电信网络监控'
      - targets: ['14.215.177.38']
        labels:
          group: '一线城市-联通网络监控'
      - targets: ['14.18.175.154']
        labels:
          group: '一线城市-移动网络监控'
grafana 配置和运行
运行grafana
在 grafana中增加 Data Sources 选 prometheus
然后按照grafana的文档新定制一个面板
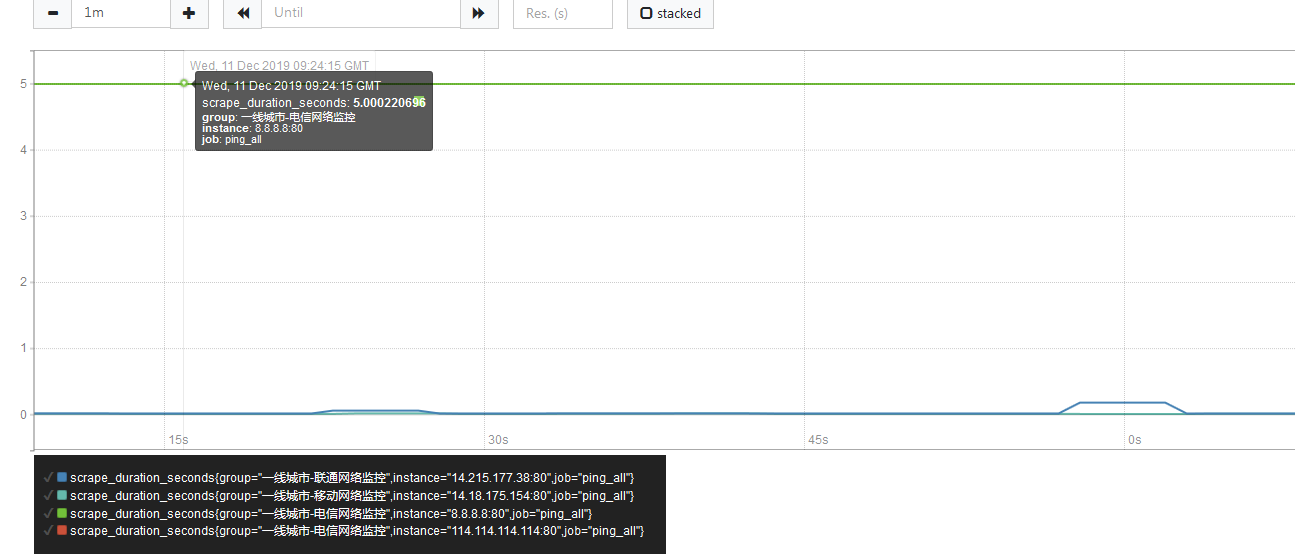
ROW中指标选
scrape_duration_seconds{job="ping_all"}
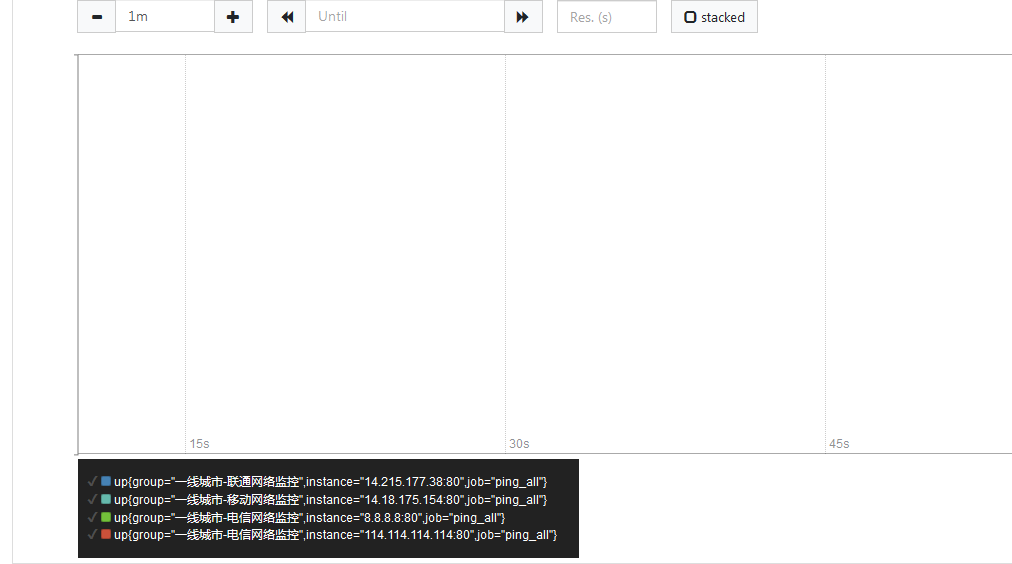
up{job="ping_all"}
来源:oschina
链接:https://my.oschina.net/u/4135913/blog/3141842