1. 基本原理
直方图均衡的变换为
- ss为变换后的灰度级,rr为变换前的灰度级
- Pr(r)Pr(r)为变换前的概率密度函数
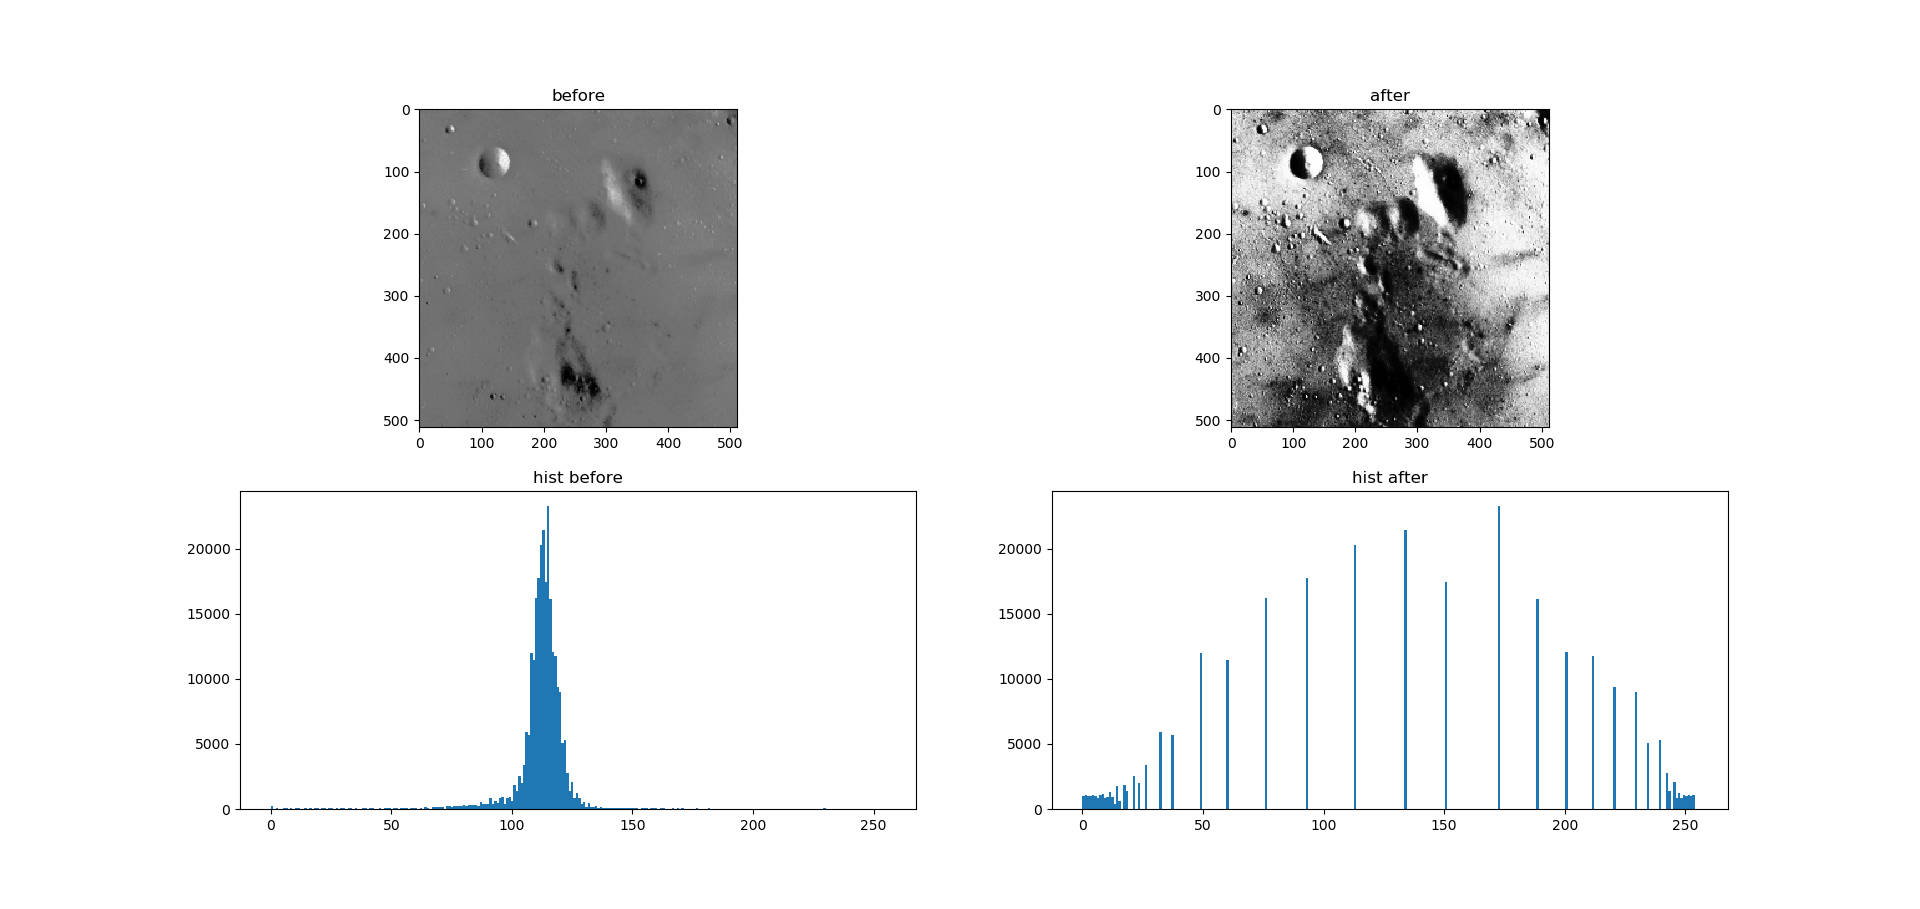
2. 测试结果

3.代码[url=]![]() [/url]
[/url]
1 import numpy as np 2 3 def hist_equalization(input_image): 4 ''' 5 直方图均衡(适用于灰度图) 6 :param input_image: 原图像 7 :return: 均衡后的图像 8 ''' 9 output_imgae = np.copy(input_image) # 输出图像,初始化为输入10 11 input_image_cp = np.copy(input_image) # 输入图像的副本12 13 m, n = input_image_cp.shape # 输入图像的尺寸(行、列)14 15 pixels_total_num = m * n # 输入图像的像素点总数16 17 input_image_grayscale_P = [] # 输入图像中各灰度级出现的概率,亦即输入图像直方图18 19 # 求输入图像中各灰度级出现的概率,亦即输入图像直方图20 for i in range(256):21 input_image_grayscale_P.append(np.sum(input_image_cp == i) / pixels_total_num)22 23 # 求解输出图像24 t = 0 # 输入图像的灰度级分布函数F25 for i in range(256):26 27 t = t + input_image_grayscale_P28 29 output_imgae[np.where(input_image_cp == i)] = 255 * t30 31 return output_imgae[url=]![]() [/url]
[/url]
4. 数学证明目标变换
- T(r)T(r)为严格单调函数,可保证反映射时,消除二义性
- pr(w)pr(w)为源图像归一化后的直方图
4.1 假定
- 图像灰度级为:[0,L−1][0,L−1]
- 源图像中,kk灰度级的像素个数:nknk
- 源图像像素总数:nn
- 原图像直方图h(rk)=nh(rk)=n
4.2 归一化后的直方图
p(rk)p(rk)即为灰度级rkrk在源图像中出现的概率估计
4.3 证明
概率密度函数的积分为分布函数,即对分布函数的导数为概率密度函数。
因为<span class="MathJax" id="MathJax-Element-17-Frame" tabindex="0" data-mathml="pr(r)" role="presentation" style="display: inline; line-height: normal; word-spacing: normal; word-wrap: normal; white-space: nowrap; float: none; direction: ltr; max-width: none; max-height: none; min-width: 0px; min-height: 0px; border: 0px; position: relative;">pr(r)pr(r)与<span class="MathJax" id="MathJax-Element-18-Frame" tabindex="0" data-mathml="T(r)" role="presentation" style="display: inline; line-height: normal; word-spacing: normal; word-wrap: normal; white-space: nowrap; float: none; direction: ltr; max-width: none; max-height: none; min-width: 0px; min-height: 0px; border: 0px; position: relative;">T(r)T(r)已知,则由
又因为
即
联立上三式及目标变换
可得
故,这意味着变换之后的图像的灰度级为均匀分布,证毕。
更多技术资讯可关注:gzitcast