1.准备数据
学习pandas需要有针对性的操作下数据才能更好的了解,这里参考官网的生成数据规则生成样例数据。
例:1880年出生的婴儿数以及他们使用的名字
- 生成“婴儿名字”列值
In [3]:
import random
import pandas as pd

# 婴儿名字的初始值
names = ['Bob','Jessica','Mary','John','Mel']
random.seed(500)
random_names = [names[random.randint(0,len(names)-1)] for i in range(10000)]
# 显示前10个名字
print(random_names[:10])
Out[3]:
['John', 'Mel', 'Mel', 'John', 'Mary', 'John', 'Jessica', 'Bob', 'Mary', 'Mel']
- 生成“婴儿数量”列值
In [4]:
births = [random.randint(0,1000) for i in range(10000)]
births[:10]
Out[4]:
[700, 975, 347, 127, 52, 598, 799, 441, 629, 656]
- 合并为二维数组,为生成DataFrame提供数据
In [5]:
BabyDataSet = list(zip(random_names,births))
BabyDataSet[:10]
Out[5]:
[('John', 700),
 ('Mel', 975),
 ('Mel', 347),
 ('John', 127),
 ('Mary', 52),
 ('John', 598),
 ('Jessica', 799),
 ('Bob', 441),
 ('Mary', 629),
 ('Mel', 656)]
- 生成DataFrame
In [6]:
df = pd.DataFrame(data = BabyDataSet, columns=['Names', 'Births'])
df[:10]
Out[6]:
| Names | Births | |
|---|---|---|
| 0 | John | 700 |
| 1 | Mel | 975 |
| 2 | Mel | 347 |
| 3 | John | 127 |
| 4 | Mary | 52 |
| 5 | John | 598 |
| 6 | Jessica | 799 |
| 7 | Bob | 441 |
| 8 | Mary | 629 |
| 9 | Mel | 656 |
- 输出为文件,index=False表示不要索引列。
In [14]:
df.to_csv('births1880.csv',index=False)
2.查看数据
在第1节准备好数据后,如果想要分析数据,则需要先读取数据。这里将使用pandas.read_csv()从 csv 文件中获取数据。
- 读取txt中的数据
In [15]:
rdf = pd.read_csv('births1880.csv')
rdf[:10]
Out[15]:
| Names | Births | |
|---|---|---|
| 0 | John | 700 |
| 1 | Mel | 975 |
| 2 | Mel | 347 |
| 3 | John | 127 |
| 4 | Mary | 52 |
| 5 | John | 598 |
| 6 | Jessica | 799 |
| 7 | Bob | 441 |
| 8 | Mary | 629 |
| 9 | Mel | 656 |
2.1.汇总信息
In [16]:
rdf.info()
<class 'pandas.core.frame.DataFrame'>
RangeIndex: 10000 entries, 0 to 9999
Data columns (total 2 columns):
 #   Column  Non-Null Count  Dtype
---  ------  --------------  -----
 0   Names   10000 non-null  object
 1   Births  10000 non-null  int64
dtypes: int64(1), object(1)
memory usage: 156.4+ KB
- 查看Names列的汇总信息
In [17]:
rdf['Names'].describe()
Out[17]:
count     10000
unique        5
top         Mel
freq       2035
Name: Names, dtype: object
2.2.查看部分数据
- 前5条数据
In [18]:
rdf.head(5)
Out[18]:
| Names | Births | |
|---|---|---|
| 0 | John | 700 |
| 1 | Mel | 975 |
| 2 | Mel | 347 |
| 3 | John | 127 |
| 4 | Mary | 52 |
- 后5条数据
In [19]:
rdf.tail(5)
Out[19]:
| Names | Births | |
|---|---|---|
| 9995 | John | 316 |
| 9996 | Mary | 813 |
| 9997 | Bob | 806 |
| 9998 | Jessica | 708 |
| 9999 | John | 528 |
- 中间数据
In [20]:
rdf[1000:1005]
Out[20]:
| Names | Births | |
|---|---|---|
| 1000 | Mel | 858 |
| 1001 | Mary | 535 |
| 1002 | John | 20 |
| 1003 | John | 285 |
| 1004 | Bob | 431 |
- 提重Names字段,sql为: distinct Names
In [21]:
rdf['Names'].unique()
Out[21]:
array(['John', 'Mel', 'Mary', 'Jessica', 'Bob'], dtype=object)
- 根据Names字段分组,sql为group by Names
In [22]:
# 创建一个 groupby 的对象
name = rdf.groupby('Names')
# 在 groupby 对象上执行求和(sum)的功能
df1 = name.sum()
df1
Out[22]:
| Births | |
|---|---|
| Names | |
| Bob | 980444 |
| Jessica | 969157 |
| John | 1009965 |
| Mary | 1001831 |
| Mel | 1018667 |
3.分析数据
要找到最高出生率的婴儿名或者是最热门的婴儿名字。方法有以下两种:
- 将
dataframe排序并且找到第一行,ascending=False倒叙排序
In [28]:
Sorted = df1.sort_values(['Births'], ascending=False)
Sorted.head(1)
Out[28]:
| Births | |
|---|---|
| Names | |
| Mel | 1018667 |
- 使用
max()属性找到最大值
In [29]:
df1['Births'].max()
Out[29]:
1018667
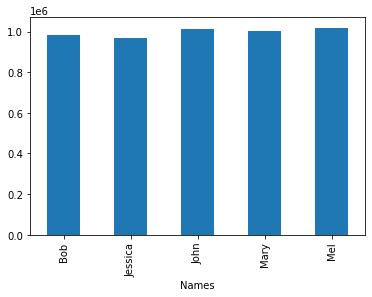
4.表现数据
将 Births 这一列标记在图形上向用户展示数值最大的点。
In [33]:
df1['Births'].plot.bar()
Out[33]:
<matplotlib.axes._subplots.AxesSubplot at 0x1922d8e70b8>

更多文章,请关注:
来源:oschina
链接:https://my.oschina.net/u/3275937/blog/3213111