Echart
还是先下载安装
npm install echarts --save
echarts官网
https://www.echartsjs.com/zh/tutorial.html#5%20%E5%88%86%E9%92%9F%E4%B8%8A%E6%89%8B%20ECharts
vue也有封装好的echarts,在使用 echarts 生成图表时,经常需要做繁琐的数据类型转化、修改复杂的配置项,v-charts 的出现正是为了解决这个痛点。基于 Vue2.0 和 echarts 封装的 v-charts 图表组件,只需要统一提供一种对前后端都友好的数据格式设置简单的配置项,便可轻松生成常见的图表。
v-charts官网
以echarts为例:
<template>
  <div>
    <div ref="chartDom" style="height:300px"></div>
  </div>
</template>

<script>
import echarts from "echarts";
import { addListener, removeListener } from "resize-detector";
import debounce from "loadsh/debounce";
export default {
  props: {
    option: {
      type: Object,
      default: () => {}
    }
  },
  watch: {
    option(val) {
      this.Chart.setOption(val);
    }
  },
  created() {
    this.resize = debounce(this.resize, 100);
  },
  mounted() {
    this.renderChart();
    addListener(this.$refs.chartDom, this.resize);
  },
  methods: {
    resize() {
      this.Chart.resize();
    },
    renderChart() {
      this.Chart = echarts.init(this.$refs.chartDom);
      this.Chart.setOption(this.option);
    }
  },
  beforeDestroy() {
    removeListener(this.$refs.chartDom, this.resize);
    this.Chart.dispose();
    this.Chart = null;
  }
};
</script>

<style></style>
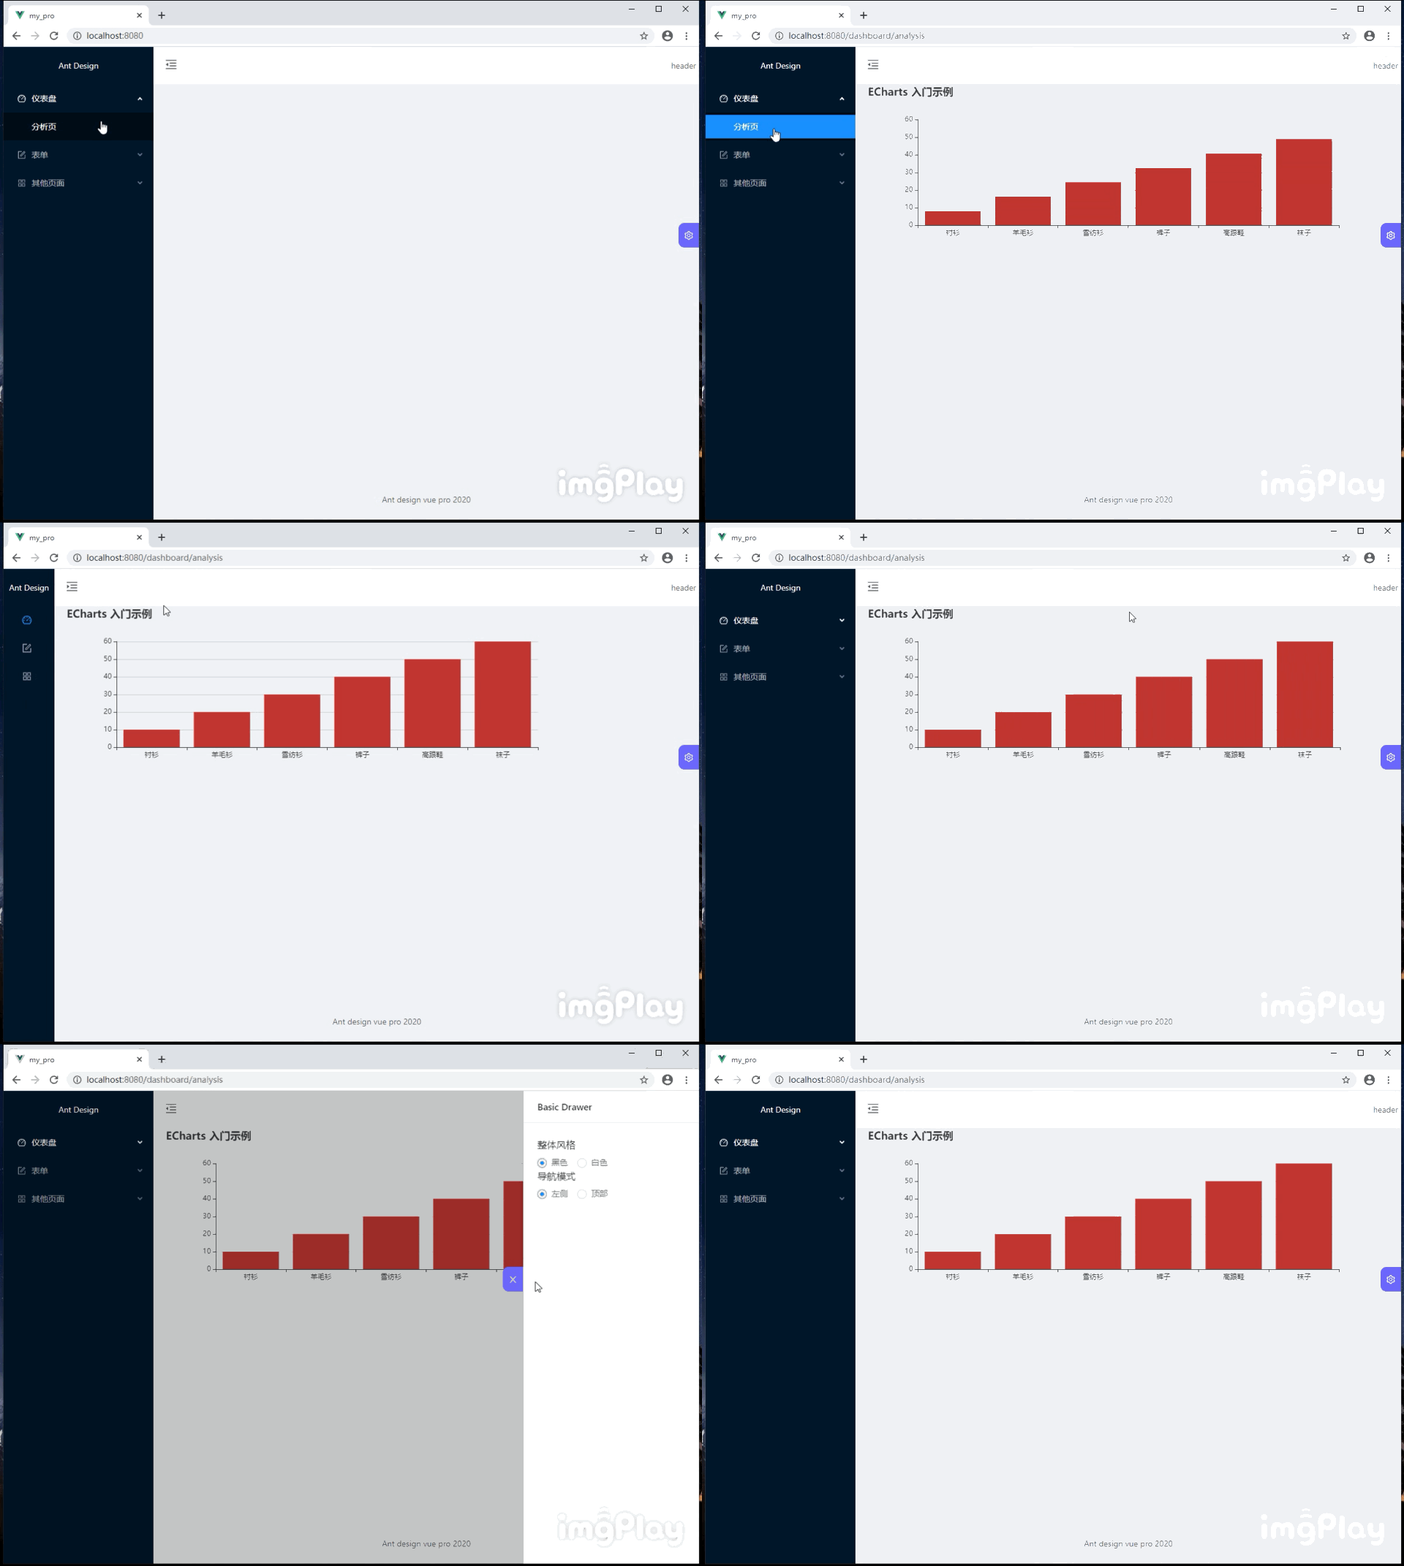
这里我是将options的值从父组件传过来的。具体数据如下
 option = {
            title: {
                text: 'ECharts 入门示例'
            },
            tooltip: {},
            legend: {
                data:['销量']
            },
            xAxis: {
                data: ["衬衫","羊毛衫","雪纺衫","裤子","高跟鞋","袜子"]
            },
            yAxis: {},
            series: [{
                name: '销量',
                type: 'bar',
                data: [10, 20, 30, 40, 50, 60]
            }]
        };
resize-detector当我们画出图像之后,当DOM尺寸发生改变,图像的尺寸是不会发生改变的。有的就会超出范围,或是没有占据整行,这里我们使用了resize-detector,可以给我们的dom元素添加监听事件。当监听到dom尺寸发生变化的时候,就调用resize。要注意的是,这里的charts宽度不能设为固定值,得用百分比,不然resize会失效。当然还是需要先下载。
npm i --save resize-detector
使用的方法,上面代码有。引入添加监听和移除监听两个事件。做相应的操作。
debounce
防抖函数,这是lodash函数库里面的一个封装好了的函数,lodash里面还提供了很多的方法。
这里设置防抖是因为在dom尺寸发生改变的时候,监听器会多出的触发。
lodash网址
最后效果图

来源:https://www.cnblogs.com/wangnothings/p/12543908.html