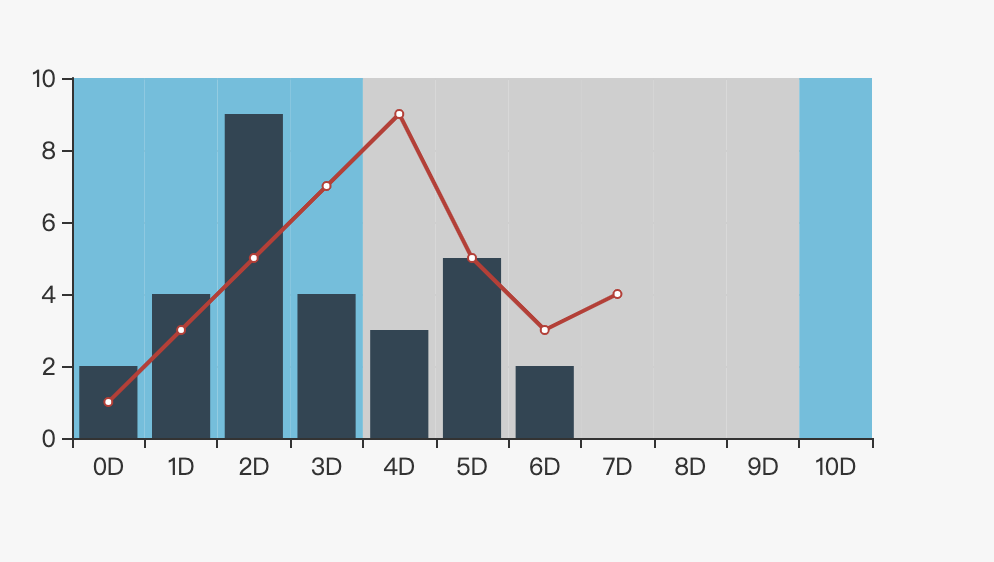
版本 4.1.0
现象
- 当设置 xAxis.splitArea.areaStyle.color 不按照制定的颜色现实, 出现颜色错位

原因
- 是因为echarts在通过xAxis.interval计算区域因为精度误差导致的问题
解决方法
- 4.5.0升级修复了该BUG,升级版本即可
参考
测试代码
-html
<!DOCTYPE html>
<html>
<head>
  <meta charset="utf-8">
  <meta name="viewport" content="width=device-width">
  <title>Echarts Test</title>
  <script src="https://cdn.bootcss.com/vue/2.6.11/vue.min.js"></script>
  <script src="https://cdn.bootcss.com/echarts/4.1.0/echarts.min.js"></script>
</head>
<body>
<div id="app">
    <div
      ref="chart"
      style="height: 300px;width: 500px"
    ></div>
  </div>
</html>
- Javascript
const app = new Vue({
  el: '#app',
  data() {
    return {
        chart: {
          data: {
            timeline: [1, 2, 3, 4, 5, 6, 7, 8, 9],
            bar: [1, 3, 5, 7, 9, 5, 3, 4],
            line: [2, 4, 9, 4, 3, 5, 2],
          },
          instance: undefined
        }
    }
  },
  computed: {
    color() {
      const color = []
      for (let index = 0; index < this.chart.data.timeline.length; index++) {
        index < 5 ? color.push('#5bc0de') : color.push('#cfcfcf')
      }
      return color
    }
  },
  methods: {
    drawChart() {
      if(!this.chart.instance) {
        this.chart.instance = echarts.init(this.$refs.chart)
      }
      this.chart.instance.clear()
      this.chart.instance.setOption({
        xAxis: {
          type: 'category',
          data: this.chart.data.timeline,
          splitArea: { show: true, areaStyle: { color: this.color } }
        },
        yAxis: {
          type: 'value'
        },
        series: [
          { data: this.chart.data.bar, type: 'line' },
          { data: this.chart.data.line, type: 'bar' }
        ]
      }, true)
    }
  },
  mounted() {
    this.drawChart()
    setInterval(() => {
      this.chart.data.timeline = new Array(Math.round(Math.random() * 50))
      for(let index = 0; index < this.chart.data.timeline.length; index++) {
        this.chart.data.timeline[index] = `${index}D`
      }
      this.drawChart()
    }, 2000)
  }
})
来源:oschina
链接:https://my.oschina.net/shadowli/blog/3187930
