Machine Learning(Andrew) ex4-Regularized Linear Regression and Bias v.s. Variance
椰汁笔记
Regularized Linear Regression
- 1.1 Visualizing the dataset
对于一个机器学习的数据,通常会被分为三部分训练集、交叉验证集和测试集。训练集用于训练参数,交叉验证集用于选择模型参数,测试集用于评价模型。
这里的作业数据,已经给我们划分好了
    data = sio.loadmat("ex5data1.mat")
    X = data["X"]
    y = data["y"]
    Xval = data["Xval"]
    yval = data["yval"]
    Xtest = data["Xtest"]
    ytest = data["ytest"]
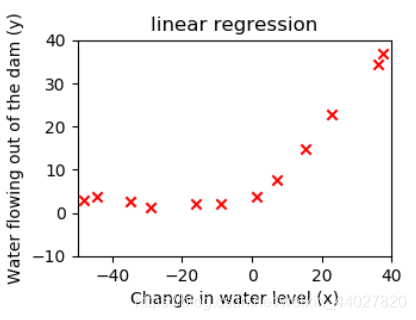
我们使用线性回归拟合的是训练集数据,因此可视化只用可视化训练集的数据
    plt.subplot(2, 2, 1)
    plt.scatter(X, y, marker='x', c='r')
    plt.xlabel("Change in water level (x)")
    plt.ylabel("Water flowing out of the dam (y)")
    plt.title("linear regression")
    plt.xlim((-50, 40))
    plt.ylim((-10, 40))
    plt.show()
数据看起来并不是那么符合线性规律hhh,感觉有点二次函数那味
- 1.2 Regularized linear regression cost function
线性回归在作业1中已经用到了,那里没有正规化,可能导致随着特征的增多出现过拟合现象。
直接在之前的损失值计算中加入惩罚项,注意不惩罚theta0
def cost(theta, X, y, l):
    m = X.shape[0]
    part1 = np.mean(np.power(X.dot(theta) - y.ravel(), 2)) / 2
    part2 = (l / (2 * m)) * np.sum(np.delete(theta * theta, 0, axis=0))
    return part1 + part2
将theta全部设置为1,lambda设置为1,进行测试
    theta = np.ones((2,))
    X = np.insert(X, 0, 1, axis=1)
    print(cost(theta, X, y, 1))#303.9931922202643
- 1.3 Regularized linear regression gradient
同样注意对j=0的情况额处理
def gradient(theta, X, y, l):
    m = X.shape[0]
    part1 = X.T.dot(X.dot(theta) - y.ravel()) / m
    part2 = (l / m) * theta
    part2[0] = 0
    return part1 + part2
将theta全部设置为1,lambda设置为1,进行测试
   theta = np.ones((2,))
    X = np.insert(X, 0, 1, axis=1)
    print(gradient(theta, X, y, 1))#[-15.30301567 598.25074417]
- 1.4 Fitting linear regression
继续使用scipy.optimize.minimize()去做优化,记得向X添加x0,这里的惩罚参数lambda取0,因为这里没有高次项。
    theta = np.ones((2,))
    X = np.insert(X, 0, 1, axis=1)
    res = opt.minimize(fun=cost, x0=theta, args=(X, y, 0), method="TNC", jac=gradient)
接着可视化拟合结果
plt.plot([i for i in range(-50, 40, 1)], [res.x[0] + res.x[1] * i for i in range(-50, 40, 1)])
其实效果并不好,后面我们就需要通过构造高次项来增加特征,实现非线性的更好。
Bias-variance
我们理解Bias和variance只需要记住,bias是欠拟合,variance是过拟合。这样接着看就不会晕。
这张图也很好地说明了这两个问题,当多项式的次数较少,显然是不可能很好的拟合,因此对于训练集和交叉验证集的误差都很大,这就是bias problem也就是欠拟合问题。当多项式次数较高时,拟合效果会非常好,但是过度拟合导致应用到更广的数据的效果不好,导致训练集误差小但交叉验证集误差大,这就是variance problem过拟合问题。这个问题的解决需要用到正则化解决。
- 2.1 Learning curves
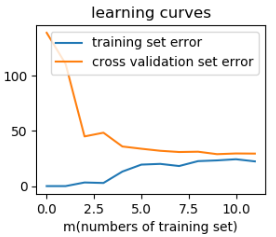
learning curves可以更加直观的对比不同参数和数据集的选择的效果,其实质就是画出随参数等其他的变化而带来的训练集和交叉验证集的误差曲线,取两个误差都比较小的情况。
我们先实现随训练数据量的变化,导致的误差变化
    Xval = np.insert(Xval, 0, 1, axis=1) #为了计算误差
    error_train = []
    error_validation = []
    for i in range(X.shape[0]):
        subX = X[:i + 1]
        suby = y[:i + 1]
        res = opt.minimize(fun=cost, x0=theta, args=(subX, suby, 1), method="TNC", jac=gradient)
        t = res.x
        error_train.append(cost(t, subX, suby, 0))
        error_validation.append(cost(t, Xval, yval, 0))
    plt.subplot(2, 2, 2)
    plt.plot([i for i in range(X.shape[0])], error_train, label="training set error")
    plt.plot([i for i in range(X.shape[0])], error_validation, label="cross validation set error")
    plt.legend(loc="upper right")
    plt.xlabel("m(numbers of training set)")
    plt.title("learning curves")
    plt.show()
首先不要关心曲线的走势,我们先看两个误差的绝对数值,随着训练集的增大,两个误差都很大,因此是high bias problem。为什么说不要看曲线走势呢,因为随着训练集的增大,肯定拟合难度更大,因此训练集的误差逐渐变大。而相应地训练结果普适性更好,因此交叉验证集地误差变小。
Polynomial regression
对于当前问题由于特征少,无法更好地拟合,因此我们需要通过构造多项式来添加特征。由于只有一个特征,我们只需要不断增加幂就行了。
def poly_features(X, power_max):
    """
    添加多次项,增加特征
    :param X: ndarray,原始特征
    :param power_max: int,最高次
    :return: ndarray,增加特征后的特征
    """
    _X = X.reshape(-1, 1)
    res = np.ones((X.shape[0], 1))
    for i in range(power_max):
        res = np.concatenate((res, np.power(_X, i + 1)), axis=1)
    return res[..., 1:]
- 3.1 Learning Polynomial Regression
这里增加了高次特征,这些高次特征的数值会非常大,因此需要归一化。
训练集、交叉验证集和测试集都应该使用同样的值进行归一化,也就是训练集归一化的值,所以要保存下来,为了后面对交叉验证集和测试集进行归一化。
    features = poly_features(data['X'], power_max)
    means = np.mean(features, axis=0)
    stds = np.std(features, axis=0, ddof=1)
    normalized_features = normalize_features(features, means, stds)
    normalized_X = np.insert(normalized_features, 0, 1, axis=1)
进行优化,这里的最大次项若选取作业上的8,由于优化方法不同,会导致曲线不同。
    # 若选取作业上的8,由于优化方法不同,会导致曲线不同
    power_max = 6
    l = 0  # 参数lambda, 取0时优化报错但不影响使用(过拟合),取100(欠拟合)
    res = opt.minimize(fun=cost, x0=np.ones((power_max + 1,)), args=(normalized_X, y, l), method="TNC", jac=gradient)
画出拟合效果
    plt.scatter(data['X'], y, marker='x', c='r')
    plt.xlabel("Change in water level (x)")
    plt.ylabel("Water flowing out of the dam (y)")
    plt.title("polynomial(8) regression")
    plt.xlim((-100, 100))
    plt.ylim((-10, 40))
    X = np.linspace(-100, 100, 50)
    normalized_X = normalize_features(poly_features(X, power_max), means, stds)
    normalized_X = np.insert(normalized_X, 0, 1, axis=1)
    plt.plot(X, normalized_X.dot(res.x))
可以说拟合效果是非常好了
接着我们来画出learning curves,首先需要将交叉验证集和测试集进行归一化,注意坑!!
    # 注意坑!!!
    # 这里需要直接利用全部训练集的归一化参数,直接将训练集和验证集数据全部归一化,以后直接在里面取即可
    # 而不是对原始训练集取后,重新选择归一化参数
    train_features = poly_features(data["X"], power_max)
    train_normalized_features = normalize_features(train_features, means, stds)
    train_normalized_X = np.insert(train_normalized_features, 0, 1, axis=1)
    val_features = poly_features(data["Xval"], power_max)
    val_normalized_features = normalize_features(val_features, means, stds)
    val_normalized_X = np.insert(val_normalized_features, 0, 1, axis=1)
接下来就是画出learn curves
    error_train = []
    error_validation = []
    for i in range(1, train_normalized_X.shape[0]):
        subX = train_normalized_X[:i + 1]
        suby = y[:i + 1]
        res = opt.minimize(fun=cost, x0=np.ones((power_max + 1,)), args=(subX, suby, l),
                           method="TNC", jac=gradient)
        t = res.x
        error_train.append(cost(t, subX, suby, 0))  # 计算error时不需要正则化
        error_validation.append(cost(t, val_normalized_X, yval, 0))
    plt.subplot(2, 2, 4)
    plt.plot([i for i in range(1, train_normalized_X.shape[0])], error_train, label="training set error")
    plt.plot([i for i in range(1, train_normalized_X.shape[0])], error_validation, label="cross validation set error")
    plt.legend(loc="upper right")
    plt.xlabel("m(numbers of training set)")
    plt.title("learning curves")
    plt.show()
由于之前提到的优化方式不同,因此和作业上的图存在误差。从图中可以看到,训练集的误差一直很小,而交叉验证集的误差虽然在变化但是和训练集的误差仍然差距较大,这里就是很明显的high varaince problem也就是过拟合问题,这需要我们通过正则化解决。
- 3.2 Optional (ungraded) exercise: Adjusting the regularization parameter
下面我们修改lambda的值,来改变正则化的影响,这里直接使用上面的代码即可
当lambda=1,可以看到这个拟合效果就很不错,而且不存在Bias和varaince问题。
当lambda=100时,可以发现对数据的拟合并不好,存在欠拟合问题(bias problem),这就是惩罚过度的问题。
- 3.3 Selecting λ using a cross validation set
从上面的例子我们看到,lambda的选择很重要,选择不合适会出现欠拟合和过拟合的情况。这里我们就用到交叉验证集,量化不同lambda时的误差,选择误差最小的作为最好的选择。
    ls = [0, 0.001, 0.003, 0.01, 0.03, 0.1, 0.3, 1, 3, 10]#候选的lambda
    error_train = []
    error_validation = []
    for l in ls:
        res = opt.minimize(fun=cost, x0=np.ones((power_max + 1,)), args=(train_normalized_X, y, l),
                           method="TNC", jac=gradient)
        error_train.append(cost(res.x, train_normalized_X, y, 0))
        error_validation.append(cost(res.x, val_normalized_X, yval, 0))
    plt.plot([i for i in ls], error_train, label="training set error")
    plt.plot([i for i in ls], error_validation, label="cross validation set error")
    plt.legend(loc="upper right")
    plt.xlabel("lambda")
    plt.ylabel("error")
    plt.title("Selecting λ using a cross validation set")
    plt.show()
从图中可以看到,error(cv)最小值时的lambda最好,大概在3左右
- 3.4 Optional (ungraded) exercise: Computing test set error
利用刚才选择的最好的lambda 3,计算测试集误差,评价模型。
这里的结果也和作业存在误差,原因是之前为了是曲线符合所以最高次取得6,若取8结果与作业相同为3.8598753028610098。
    test_features = poly_features(Xtest, power_max)
    test_normalized_features = normalize_features(test_features, means, stds)
    test_normalized_X = np.insert(test_normalized_features, 0, 1, axis=1)
    res = opt.minimize(fun=cost, x0=np.ones((power_max + 1,)), args=(train_normalized_X, y, 3),
                       method="TNC", jac=gradient)
    print(cost(res.x, test_normalized_X, ytest, 0))#4.7552615904740145
- 3.5 Optional (ungraded) exercise: Plotting learning curves with randomly selected examples
绘制学习曲线以调试算法时,通常对多组随机选择的样本取平均值来确定训练误差和交叉验证误差通常会很有帮助。首先从训练集中随机选择i个示例,从交叉验证集中随机选择i个示例。然后,您将使用随机选择的训练集学习参数θ,并在随机选择的训练集和交叉验证集上评估参数θ。然后,应将上述步骤重复多次(例如50次),并且应使用平均误差来确定示例的训练误差和交叉验证误差。
这里我们仅实现简单随机选择数据
def randomly_select(data, n):
    """
    从数据集中随机取出n组
    :param data: ndarray,数据
    :param n: int,选择数量
    :return: ndarray,随机选择的数据
    """
    res = np.array(data)
    m = data.shape[0]
    for i in range(m - n):
        index = np.random.randint(0, res.shape[0] - 1)
        res = np.delete(res, index, axis=0)
    return res
画出图像
    error_train = []
    error_validation = []
    for i in range(X.shape[0]):
    	# 随机选择训练集
        Xy = randomly_select(np.concatenate((train_normalized_X, y), axis=1), i + 1)
        subtrainX = Xy[..., :-1]
        subtrainy = Xy[..., -1]
        res = opt.minimize(fun=cost, x0=np.ones((power_max + 1,)), args=(subtrainX, subtrainy, 0.01), method="TNC",
                           jac=gradient)
        t = res.x
        error_train.append(cost(t, subtrainX, subtrainy, 0.01))
        # 随机选择交叉验证集
        Xy = randomly_select(np.concatenate((val_normalized_X, yval), axis=1), i + 1)
        subvalX = Xy[..., :-1]
        subvaly = Xy[..., -1]
        error_validation.append(cost(t, subvalX, subvaly, 0.01))
    plt.plot([i for i in range(X.shape[0])], error_train, label="training set error")
    plt.plot([i for i in range(X.shape[0])], error_validation, label="cross validation set error")
    plt.legend(loc="upper right")
    plt.xlabel("m(numbers of training set)")
    plt.title("learning curves(randomly select)")
    plt.show()
由于是随机选择,图像是不固定的

最后总结一下,学习bias和variance的作用就是更好理解当前模型存在问题,对症下药。而不是一味地去增加数据量。根据learn curves我们分析其中地问题,解决参考方法如下:
| high bias problem | high variance problem |
|---|---|
| 尝试增加额外的特征 | 获取更多地数据 |
| 增加多项式特征 | 将特征数量减少 |
| 降低lambda | 提高lambda |
完整的代码会同步 在我的github
欢迎指正错误
来源:CSDN
作者:生榨的椰汁
链接:https://blog.csdn.net/weixin_44027820/article/details/104577199