所有演示都采用 MPAndroidChart v3.1.0
官方地址:https://github.com/PhilJay/MPAndroidChart
首先要感谢作者写出这么强大的图表控件让我们免费使用,如果您条件匀许可以a coffee (or some beer) for him。
工作中,经常会用到图表控件,以直观的方式来给用户感性的认识,可以是门店销量比对,可以是门店的日月报表,也可以是会员消费的排行等等。
工欲善其事,必先利其器。
好的工具,不会用,也是枉然。
然而,好的东西肯定有它一定的使用方法,如何简单的使用,那就需要有人尝试,有人研究。
然后结果证明,使用往往是简单的,但是不了解的时候,会花费大量的时间与精力,到最好可能也就是一行代码的事。
这也是我来写这个的初衷吧。
这里我来讲一下我们在工作中实际业务中,是如何来处理这个报表控件的。
1、先来了解下它


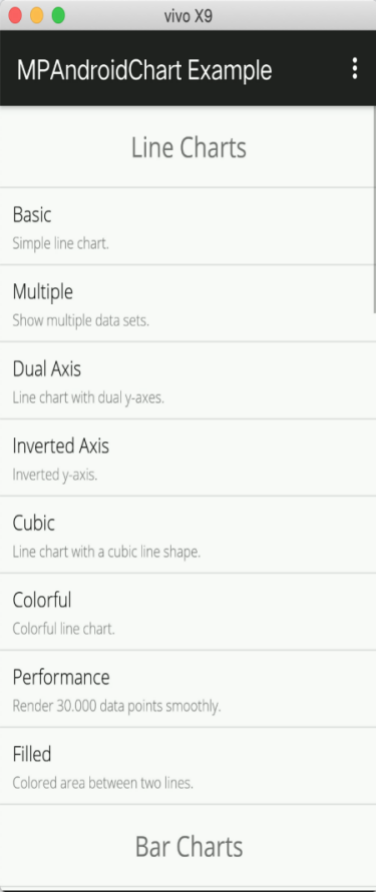
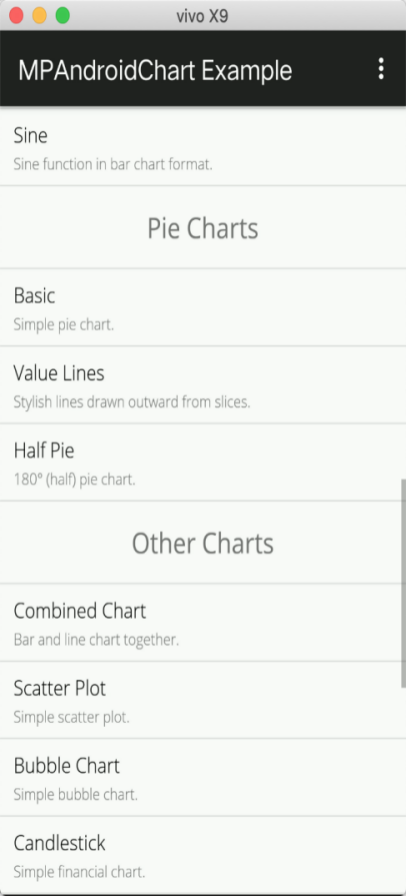
以上的截图是官方提供的例子,这个很重要,因为他给我们提供了很大的帮助,好多都可以直接搬过来用,不需要再去看文档。
其中包括:Line Charts折线图 Bar Charts柱状图 Pie Charts饼图 Other Charts其它……
1)如何打开这个例子:
我使用的是Android Studio 3.5.3 , 前段时间刚刚升级,其实如果是维护产品的话,升级不升级,还要看情况。
有个前提:在使用第三方提供的Lib的时候,我们得跟上这个源程序的Lib,好多时候,我们一转眼,有些项目就升级了,原来的API就不存在了,或者在网上找了一堆关于这个第三方控件的,因为版本的问题,根本就用不上,当你比较着急做项目的时候,特别是加班,我想如果你做过几年开发,那肯定是有心德体会的。
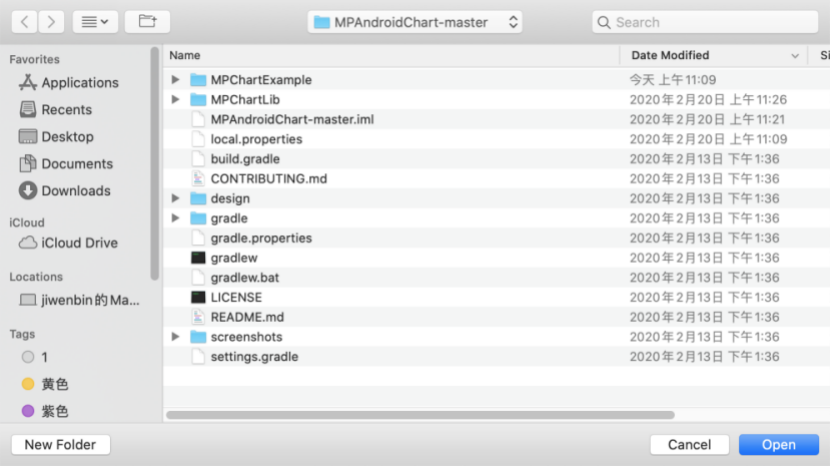
v 打开Android Studio, File -- Open

打开后,会有些jar的下载过程,稍等下,在这里,我碰到了很多问题,大体上是握手没有通过,后来找了下,才知道是我开了防火墙。关了重新打开就可以,稍等下,一切都会OK。
v 打开后,我们会发现有二个Modules

一个是Example(例子),另一个是Lib(提供API)
点击 “运行” 就可以安装到手机上,或者模拟器上,我一般在真机上测试。
好了,到此例子就运行了,有兴趣可以自已先看一下。
2)我们来看看一个图表,大概有几部分组成
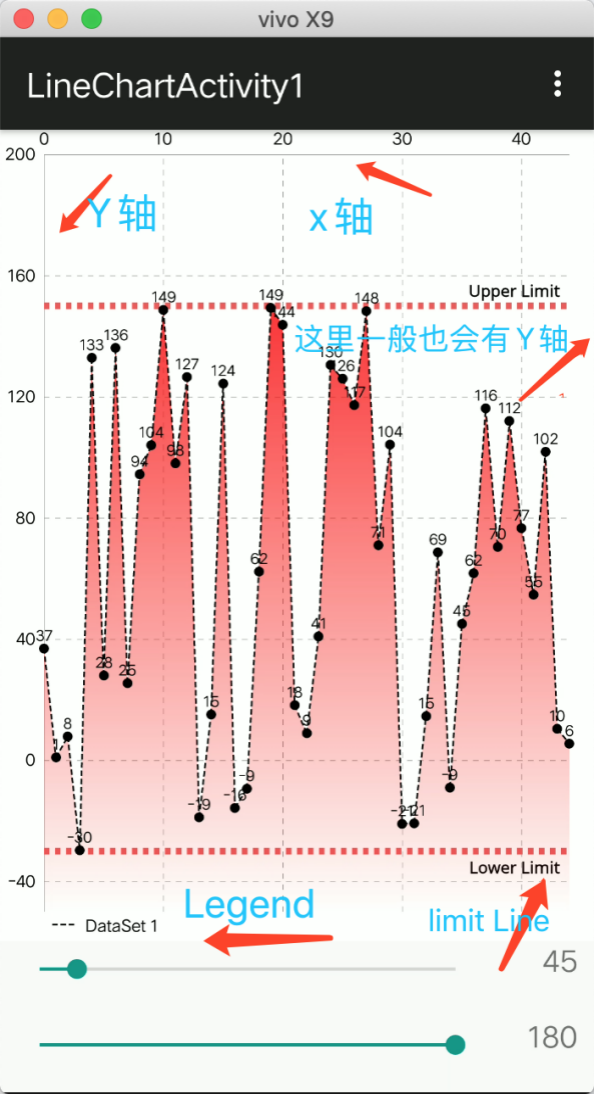
v 先上一张图,也就是例子中的第一张图

这是个折线图,有X轴,Y轴(一般左右各一个,这里右边的Y轴隐藏了),Legend, Limit Line。
x轴:chart.getXAxis(); chart代表是图表对象,x轴可以设置在上,还是在下显示。
XAxis xl = chart.getXAxis();
xl.setPosition(XAxisPosition.BOTTOM);
这里设置显示在下方。
y轴:
YAxis yl = chart.getAxisLeft();左侧的Y轴。
YAxis yr = chart.getAxisRight();右侧的Y轴。
Legend:说明区别各个图表类型特定的设置,比如说各个门店的对比,我们可以自定义这个Legend来加一个适合我们项目的说明。
这里的门店就是Legend区域。
Limit Line: 限制线;极限线;界线 , 比如说我们要写一个产品合格率的,这个就挺不错的,到哪是合格,那是不合格的,这样一目了然。
图中的虚线Upper Limit,Lower Limit就是一个Limit Line ,当然样式也是可以自定义的。
2、实例中我们是如何来使用的
1)一般我们在做项目的时候,都会有步骤,我们来看一下加入图表一般有几个步骤
2)步骤
u XML中加入这个控件
<com.github.mikephil.charting.charts.HorizontalBarChart
android:id="@+id/chart1"
android:layout_width="match_parent"
android:layout_height="match_parent"
android:background="@android:color/white"
android:layout_above="@+id/seekBar1" />
u 代码中我们要拿到这个控件
private HorizontalBarChart chart;
@Override
protected void onCreate(Bundle savedInstanceState) {
super.onCreate(savedInstanceState);
chart = findViewById(R.id.chart1);
chart.setOnChartValueSelectedListener(this);
……
}
u 对这个控件作一些设置,这步完成以后,大体的框架出来了
//在图表上显示值
chart.setDrawValueAboveBar(true);
//不显示图表中的说明
chart.getDescription().setEnabled(false);
// if more than 60 entries are displayed in the chart, no values will be
// drawn
chart.setMaxVisibleValueCount(60);
// scaling can now only be done on x- and y-axis separately
chart.setPinchZoom(false);
// draw shadows for each bar that show the maximum value
// chart.setDrawBarShadow(true);
chart.setDrawGridBackground(false);
//x轴
XAxis xl = chart.getXAxis();
xl.setPosition(XAxisPosition.BOTTOM);
xl.setTypeface(tfLight);
xl.setDrawAxisLine(true);
xl.setDrawGridLines(false);
xl.setGranularity(10f);
//y轴 左侧
YAxis yl = chart.getAxisLeft();
yl.setTypeface(tfLight);
yl.setDrawAxisLine(true);
yl.setDrawGridLines(true);
yl.setAxisMinimum(0f); // this replaces setStartAtZero(true)
// yl.setInverted(true);
//y轴 左侧
YAxis yr = chart.getAxisRight();
yr.setTypeface(tfLight);
yr.setDrawAxisLine(true);
yr.setDrawGridLines(false);
yr.setAxisMinimum(0f); // this replaces setStartAtZero(true)
// yr.setInverted(true);
u 给图表一个数据,让其能显示出来
ArrayList<Entry> values = new ArrayList<>();
for (int i = 0; i < count; i++) {
float val = (float) (Math.random() * range) - 30;
values.add(new Entry(i, val, getResources().getDrawable(R.drawable.star)));
}
LineDataSet set1;
if (chart.getData() != null &&
chart.getData().getDataSetCount() > 0) {
set1 = (LineDataSet) chart.getData().getDataSetByIndex(0);
set1.setValues(values);
set1.notifyDataSetChanged();
chart.getData().notifyDataChanged();
chart.notifyDataSetChanged();
} else {
// create a dataset and give it a type
set1 = new LineDataSet(values, "DataSet 1");
}
如果存在dataset,那么直接赋值,如果不存在,那么新建一个。
u 加到数据到DataSet , 展示数据
ArrayList<ILineDataSet> dataSets = new ArrayList<>();
dataSets.add(set1); // add the data sets
这里可以增加多条折线,只要有多个数据,多个LineDataSet即可。
// create a data object with the data sets
LineData data = new LineData(dataSets);
// set data
chart.setData(data);
这样我们基本上是有个概念了,为下面的实例来作准备。
来源:https://www.cnblogs.com/jiduoduo/p/12388340.html