本文主要参考书籍为《统计学习方法》(李航)第二版
感知机
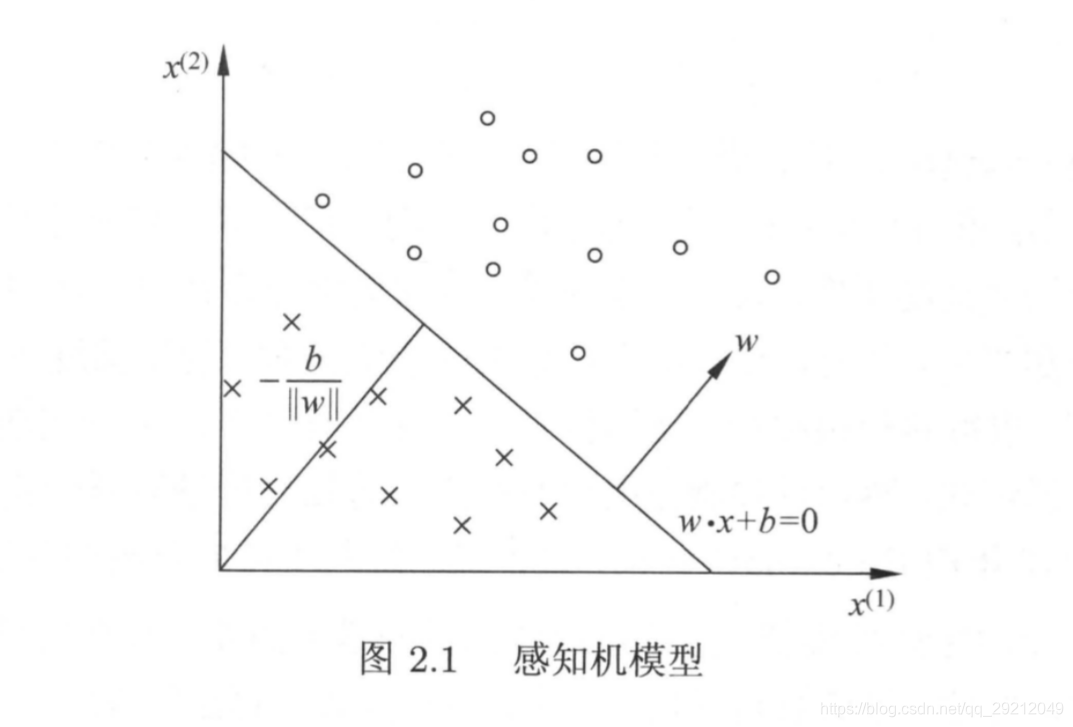
是二类分类的线性分类模型,其输入为实例的特征向量,输出为实例的类别,取+1和-1二值。感知机对应于输入空间(特征空间)中将实例划分为正负两类的分离超平面,属于判别模型。
感知机学习旨在求出将训练数据进行线性划分的分离超平面,为此,导入基于误分类的损失函数,利用梯度下降法对损失函数进行极小化求得感知机模型。
即寻找一个超平面将把线性可分数据集分布在这个超平面的两侧。
线性可分数据集:存在某个超平面可以将数据集的正实例点和负的实例点完全正确的划分到超平面的两侧,这样的数据集称作线性可分数据集,否则是非线性可分数据集。感知机要求数据集是线性可分的。
定义
假设
输入空间(特征空间)是
输出空间是
输入x属于X表示实例的特征向量,对应于输入空间(特征空间)的点;
输出y属于 Y表示实例的类别。
由输入空间到输出空间的函数为 f(x)=sign(w⋅x+b)
x 表示实例的特征向量,w 表示权值向量, w⋅x 表示 w 和 x 的内积
sign函数表示: 从几何角度进行表示感知机模型

感知机学习策略
为了找出目标的超平面,即确定感知机模型参数w,b。需要确定一个学习策略,即定义(经验)损失函数并将损失函数极小化。
损失函数:选择误分类点到超平面S的总距离,而不是误分类点的总数。
在构造感知机的损失函数时,最自然的选择是误分类点的总数,但这样的话,损失函数不是连续可导函数。
m是误分类的数据集
感知机学习算法
学习方式采用随机梯度下降法,每次寻找一个误分类的(xi,yi)。
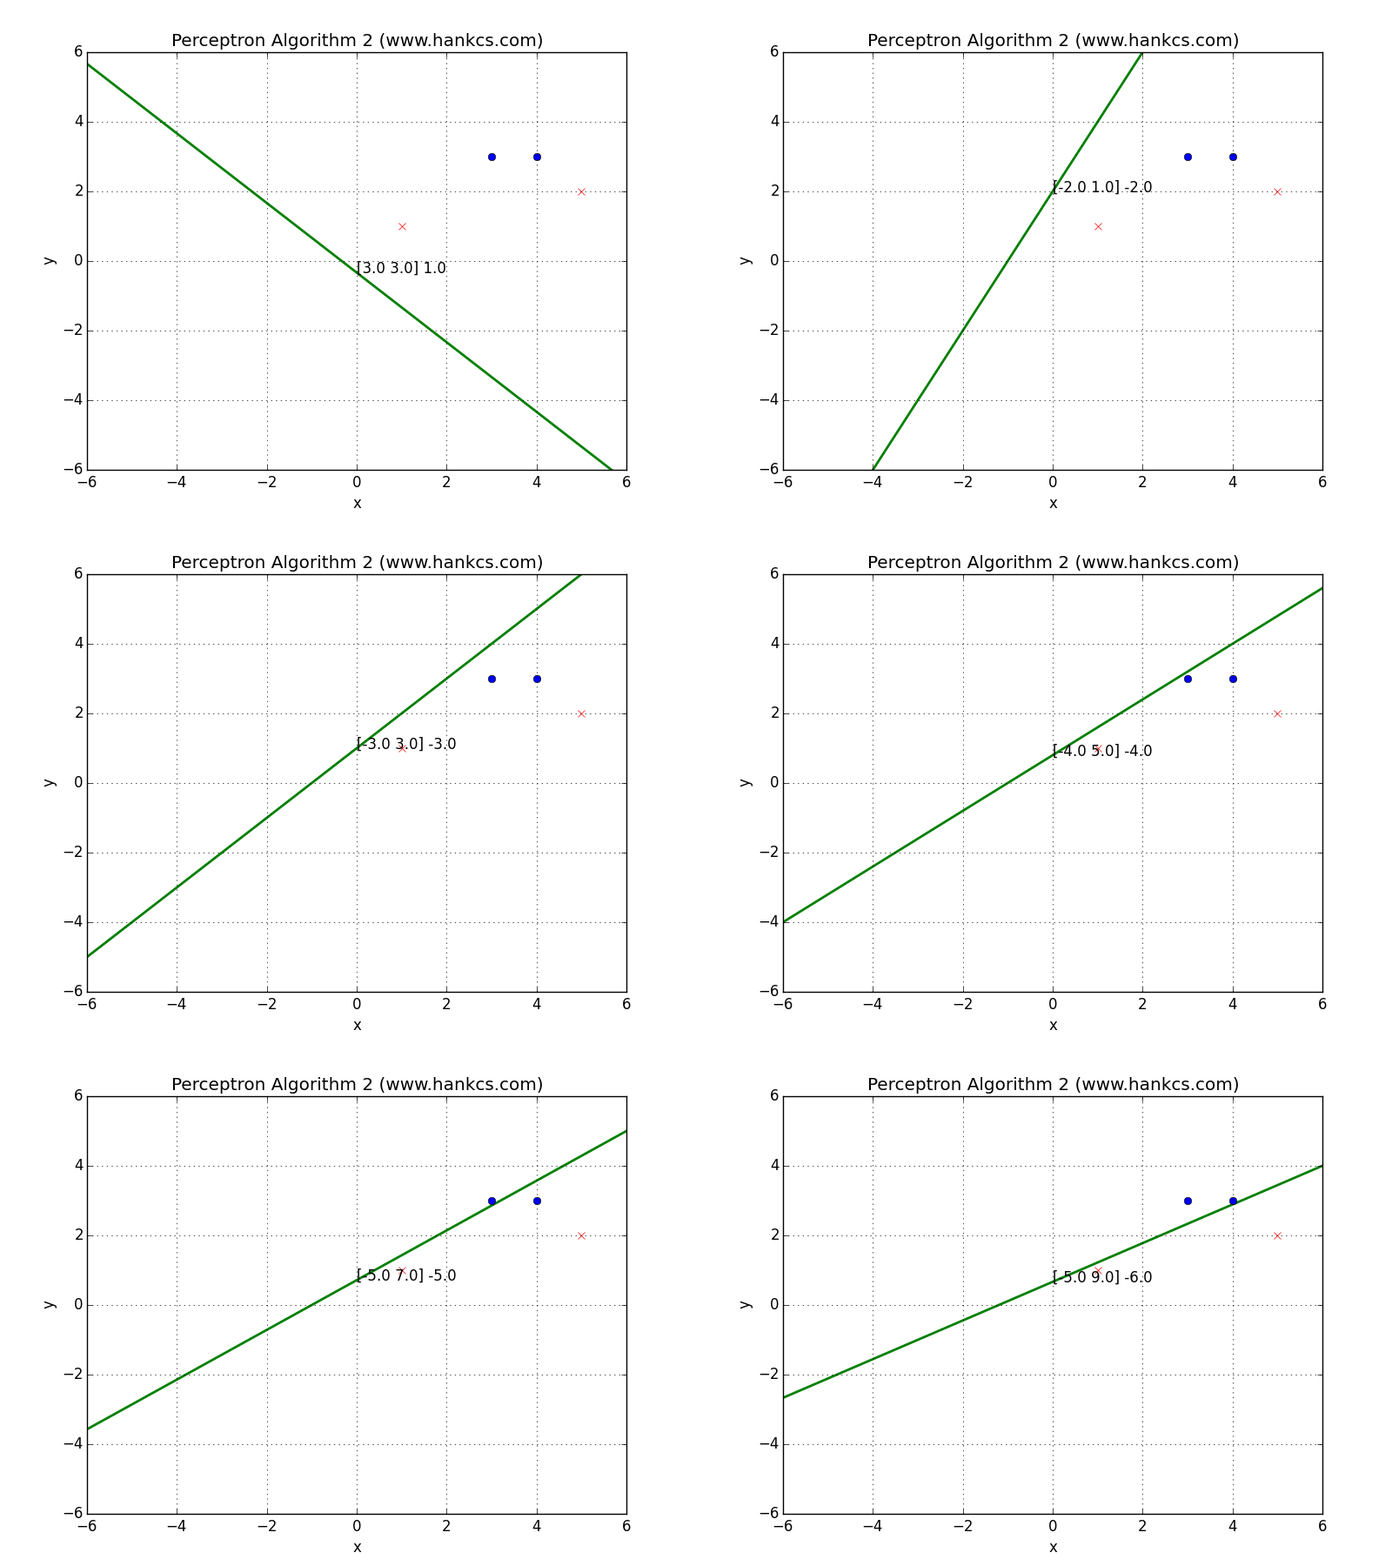
直观上可以看成,当被选择的实例点位于超平面错误的一侧,则调整ω与b,使得超平面向该误分类点一侧移动,减小该误分类点到超平面的距离,直至所有误分类点都被正确分类。
如下图 测试集为{ [[3, 3], 1], [[4, 3], 1], [[1, 1], -1], [[5, 2], -1]}
原始形式

代码实现(出自码农场)
# -*- coding:utf-8 -*-
# Filename: train2.1.py
# Author:hankcs
# Date: 2015/1/30 16:29
import copy
from matplotlib import pyplot as plt
from matplotlib import animation

training_set = [[(3, 3), 1], [(4, 3), 1], [(1, 1), -1]]
w = [0, 0]
b = 0
history = []


def update(item):
    """
    update parameters using stochastic gradient descent
    :param item: an item which is classified into wrong class
    :return: nothing
    """
    global w, b, history
    w[0] += 1 * item[1] * item[0][0]
    w[1] += 1 * item[1] * item[0][1]
    b += 1 * item[1]
    print
    w, b
    history.append([copy.copy(w), b])
    # you can uncomment this line to check the process of stochastic gradient descent


def cal(item):
    """
    calculate the functional distance between 'item' an the dicision surface. output yi(w*xi+b).
    :param item:
    :return:
    """
    res = 0
    for i in range(len(item[0])):
        res += item[0][i] * w[i]
    res += b
    res *= item[1]
    return res


def check():
    """
    check if the hyperplane can classify the examples correctly
    :return: true if it can
    """
    flag = False
    for item in training_set:
        if cal(item) <= 0:
            flag = True
            update(item)
    # draw a graph to show the process
    if not flag:
        print
        "RESULT: w: " + str(w) + " b: " + str(b)
    return flag


if __name__ == "__main__":
    for i in range(1000):
        if not check(): break

    # first set up the figure, the axis, and the plot element we want to animate
    fig = plt.figure()
    ax = plt.axes(xlim=(0, 2), ylim=(-2, 2))
    line, = ax.plot([], [], 'g', lw=2)
    label = ax.text([], [], '')


    # initialization function: plot the background of each frame
    def init():
        line.set_data([], [])
        x, y, x_, y_ = [], [], [], []
        for p in training_set:
            if p[1] > 0:
                x.append(p[0][0])
                y.append(p[0][1])
            else:
                x_.append(p[0][0])
                y_.append(p[0][1])

        plt.plot(x, y, 'bo', x_, y_, 'rx')
        plt.axis([-6, 6, -6, 6])
        plt.grid(True)
        plt.xlabel('x')
        plt.ylabel('y')
        plt.title('Perceptron Algorithm (www.hankcs.com)')
        return line, label


    # animation function.  this is called sequentially
    def animate(i):
        global history, ax, line, label

        w = history[i][0]
        b = history[i][1]
        if w[1] == 0: return line, label
        x1 = -7
        y1 = -(b + w[0] * x1) / w[1]
        x2 = 7
        y2 = -(b + w[0] * x2) / w[1]
        line.set_data([x1, x2], [y1, y2])
        x1 = 0
        y1 = -(b + w[0] * x1) / w[1]
        label.set_text(history[i])
        label.set_position([x1, y1])
        return line, label


    # call the animator.  blit=true means only re-draw the parts that have changed.
    print
    history
    anim = animation.FuncAnimation(fig, animate, init_func=init, frames=len(history), interval=1000, repeat=True,
                                   blit=True)
    plt.show()
    anim.save('perceptron.gif', fps=2, writer='imagemagick')
对偶形式
对偶形式的基本想法是:将w和b表示为实例xi和标记yi的线性组合的形式,通过求解其系数而求得w和b
 对偶形式代码实现(出自码农场)
    # -*- coding:utf-8 -*-
    # Filename: train2.2.py
    # Author:hankcs
    # Date: 2015/1/31 15:15
    import numpy as np
    from matplotlib import pyplot as plt
    from matplotlib import animation

    # An example in that book, the training set and parameters' sizes are fixed
    training_set = np.array([[[3, 3], 1], [[4, 3], 1], [[1, 1], -1]])

    a = np.zeros(len(training_set), np.float)
    b = 0.0
    Gram = None
    y = np.array(training_set[:, 1])
    x = np.empty((len(training_set), 2), np.float)
    for i in range(len(training_set)):
        x[i] = training_set[i][0]
    history = []

    def cal_gram():
        """
        calculate the Gram matrix
        :return:
        """
        g = np.empty((len(training_set), len(training_set)), np.int)
        for i in range(len(training_set)):
            for j in range(len(training_set)):
                g[i][j] = np.dot(training_set[i][0], training_set[j][0])
        return g


    def update(i):
        """
        update parameters using stochastic gradient descent
        :param i:
        :return:
        """
        global a, b
        a[i] += 1
        b = b + y[i]
        history.append([np.dot(a * y, x), b])
        # print a, b # you can uncomment this line to check the process of stochastic gradient descent


    # calculate the judge condition
    def cal(i):
        global a, b, x, y

        res = np.dot(a * y, Gram[i])
        res = (res + b) * y[i]
        return res


    # check if the hyperplane can classify the examples correctly
    def check():
        global a, b, x, y
        flag = False
        for i in range(len(training_set)):
            if cal(i) <= 0:
                flag = True
                update(i)
        if not flag:

            w = np.dot(a * y, x)
            print "RESULT: w: " + str(w) + " b: " + str(b)
            return False
        return True


    if __name__ == "__main__":
        Gram = cal_gram()  # initialize the Gram matrix
        for i in range(1000):
            if not check(): break

        # draw an animation to show how it works, the data comes from history
        # first set up the figure, the axis, and the plot element we want to animate
        fig = plt.figure()
        ax = plt.axes(xlim=(0, 2), ylim=(-2, 2))
        line, = ax.plot([], [], 'g', lw=2)
        label = ax.text([], [], '')

        # initialization function: plot the background of each frame
        def init():
            line.set_data([], [])
            x, y, x_, y_ = [], [], [], []
            for p in training_set:
                if p[1] > 0:
                    x.append(p[0][0])
                    y.append(p[0][1])
                else:
                    x_.append(p[0][0])
                    y_.append(p[0][1])

            plt.plot(x, y, 'bo', x_, y_, 'rx')
            plt.axis([-6, 6, -6, 6])
            plt.grid(True)
            plt.xlabel('x')
            plt.ylabel('y')
            plt.title('Perceptron Algorithm 2 (www.hankcs.com)')
            return line, label


        # animation function.  this is called sequentially
        def animate(i):
            global history, ax, line, label

            w = history[i][0]
            b = history[i][1]
            if w[1] == 0: return line, label
            x1 = -7.0
            y1 = -(b + w[0] * x1) / w[1]
            x2 = 7.0
            y2 = -(b + w[0] * x2) / w[1]
            line.set_data([x1, x2], [y1, y2])
            x1 = 0.0
            y1 = -(b + w[0] * x1) / w[1]
            label.set_text(str(history[i][0]) + ' ' + str(b))
            label.set_position([x1, y1])
            return line, label

        # call the animator.  blit=true means only re-draw the parts that have changed.
        anim = animation.FuncAnimation(fig, animate, init_func=init, frames=len(history), interval=1000, repeat=True,
                                       blit=True)
        plt.show()
        # anim.save('perceptron2.gif', fps=2, writer='imagemagick')
本文为个人读书笔记
参考李航老师出版的《统计学习方法》
参考资料:
理解超平面
http://www.sohu.com/a/206572358_160850
https://blog.csdn.net/Leon_winter/article/details/86590691
https://blog.csdn.net/Leon_winter/article/details/84865356#%E4%B8%89%E7%A7%8D%E5%9F%BA%E6%9C%AC%E7%9A%84SVM%EF%BC%9A
感知机原始版本实现https://blog.csdn.net/a19990412/article/details/82745403
https://blog.csdn.net/u011098721/article/details/52204610
感知机代码实现:https://www.hankcs.com/ml/the-perceptron.html
来源:CSDN
作者:多好篝火
链接:https://blog.csdn.net/qq_29212049/article/details/104018824