这几天我决定花一些时间,逐个研究下.NET中的Chart控件。
我的IDE版本为VS2012,.NET框架版本为.NET 4.5
运行本文代码需要用到命名空间System.Windows.Forms.DataVisualization.Charting
1、饼图(SeriesChartType.Pie)
现有一个Chart控件,取名为chart,在程序Load函数中输入如下代码:
private void FormMain_Load(object sender, EventArgs e)
{
    //清空chart图表
    chart.ChartAreas.Clear(); //图表区
    chart.Titles.Clear(); //图表标题
    chart.Series.Clear(); //图表序列
    chart.Legends.Clear(); //图表图例

    //新建chart图表要素
    chart.ChartAreas.Add(new ChartArea("chartArea"));
    chart.ChartAreas["chartArea"].AxisX.IsMarginVisible = false;
    chart.ChartAreas["chartArea"].Area3DStyle.Enable3D = false;
    chart.Titles.Add("某行业各公司市场占有率调查报告"); //标题
    chart.Titles[0].Font = new Font("宋体", 20);
    chart.Series.Add("data");
    chart.Series["data"].ChartType = SeriesChartType.Pie; //图标类型
    chart.Series["data"]["PieLabelStyle"] = "Outside";
    chart.Series["data"]["PieLineColor"] = "Black";
    chart.Legends.Add(new Legend("legend"));
    chart.Palette = ChartColorPalette.BrightPastel;

    //为chart图表赋值
    //点1
    int idxA = chart.Series["data"].Points.AddY(20);
    DataPoint pointA = chart.Series["data"].Points[idxA];
    pointA.Label = "甲公司";
    pointA.LegendText = "#LABEL(#VAL) #PERCENT{P2}";
    //点2
    int idxB = chart.Series["data"].Points.AddY(15);
    DataPoint pointB = chart.Series["data"].Points[idxB];
    pointB.Label = "乙公司";
    pointB.LegendText = "#LABEL(#VAL) #PERCENT{P2}";
    //点3
    int idxC = chart.Series["data"].Points.AddY(30);
    DataPoint pointC = chart.Series["data"].Points[idxC];
    pointC.Label = "丙公司";
    pointC.LegendText = "#LABEL(#VAL) #PERCENT{P2}";
    //点4
    int idxD = chart.Series["data"].Points.AddY(30);
    DataPoint pointD = chart.Series["data"].Points[idxD];
    pointD.Label = "丁公司";
    pointD.LegendText = "#LABEL(#VAL) #PERCENT{P2}";
    //点5
    int idxE = chart.Series["data"].Points.AddY(85);
    DataPoint pointE = chart.Series["data"].Points[idxE];
    pointE.Label = "戊公司";
    pointE.LegendText = "#LABEL(#VAL) #PERCENT{P2}";
}
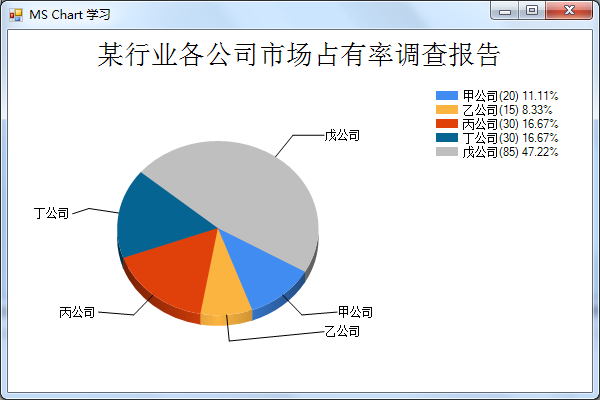
绘制好的图像,效果如下:

将ChartArea的属性Area3DStyle.Enable3D改为true,效果如下:

2、圆环图(SeriesChartType.Doughnut)
图表控件的标识符还用chart不变:
private void FormMain_Load(object sender, EventArgs e)
{
    //清空chart图表
    chart.ChartAreas.Clear(); //图表区
    chart.Titles.Clear(); //图表标题
    chart.Series.Clear(); //图表序列
    chart.Legends.Clear(); //图表图例

    //新建chart图表要素
    chart.ChartAreas.Add(new ChartArea("chartArea"));
    chart.ChartAreas["chartArea"].AxisX.IsMarginVisible = false;
    chart.ChartAreas["chartArea"].Area3DStyle.Enable3D = false;
    chart.Titles.Add("某行业各公司市场占有率调查报告");
    chart.Titles[0].Font = new Font("宋体", 20);
    chart.Series.Add("data");
    chart.Series["data"].ChartType = SeriesChartType.Doughnut; //这一行与上个例子不同
    chart.Series["data"]["PieLabelStyle"] = "Outside";
    chart.Series["data"]["PieLineColor"] = "Black";
    chart.Legends.Add(new Legend("legend"));
    chart.Palette = ChartColorPalette.BrightPastel;

    //为chart图表赋值
    //点1
    int idxA = chart.Series["data"].Points.AddY(20);
    DataPoint pointA = chart.Series["data"].Points[idxA];
    pointA.Label = "甲公司";
    pointA.LegendText = "#LABEL(#VAL) #PERCENT{P2}";
    //点2
    int idxB = chart.Series["data"].Points.AddY(15);
    DataPoint pointB = chart.Series["data"].Points[idxB];
    pointB.Label = "乙公司";
    pointB.LegendText = "#LABEL(#VAL) #PERCENT{P2}";
    //点3
    int idxC = chart.Series["data"].Points.AddY(30);
    DataPoint pointC = chart.Series["data"].Points[idxC];
    pointC.Label = "丙公司";
    pointC.LegendText = "#LABEL(#VAL) #PERCENT{P2}";
    //点4
    int idxD = chart.Series["data"].Points.AddY(30);
    DataPoint pointD = chart.Series["data"].Points[idxD];
    pointD.Label = "丁公司";
    pointD.LegendText = "#LABEL(#VAL) #PERCENT{P2}";
    //点5
    int idxE = chart.Series["data"].Points.AddY(85);
    DataPoint pointE = chart.Series["data"].Points[idxE];
    pointE.Label = "戊公司";
    pointE.LegendText = "#LABEL(#VAL) #PERCENT{P2}";
}
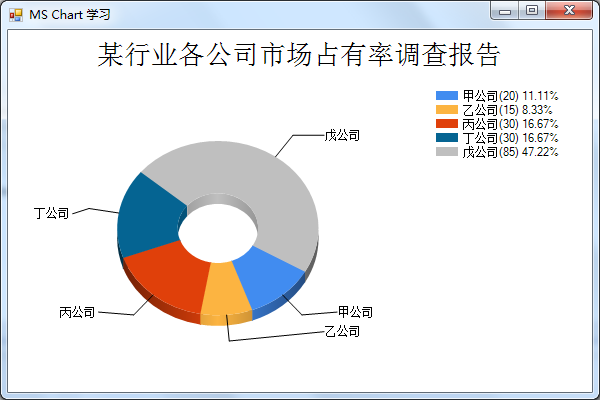
绘制好的图像,效果如下:

将ChartArea的属性Area3DStyle.Enable3D改为true,效果如下:

注意:
1、MS Chart支持的绘图种类可以参考:
https://msdn.microsoft.com/library/system.web.ui.datavisualization.charting.seriescharttype.aspx
2、除了IDE中所见即所得的编辑可修改的部分外,Chart还有一些自定义属性,详见页面:
https://msdn.microsoft.com/zh-cn/library/dd456764
END
来源:oschina
链接:https://my.oschina.net/u/1425762/blog/639670