class numpy.poly1d(c_or_r, r=False, variable=None)[source]
参数:
c_or_r:array_like
多项式的系数,或者如果第二个参数的值是True,多项式的根(值多项式的求值结果为0)。
例如,poly1d([1, 2, 3])返回一个对象,代表:
x ^ 2 + 2 + 3,
而poly1d((1、2、3),真正的)返回一个对象,代表:
(x - 1) (x - 2) (3) = x ^ 3 - 6 x ^ 2 + 11 * 6。
r: bool,可选
如果为真,c_or_r指定多项式的根;默认值为False。
variable:str,可选
将打印p时使用的变量从x改为变量

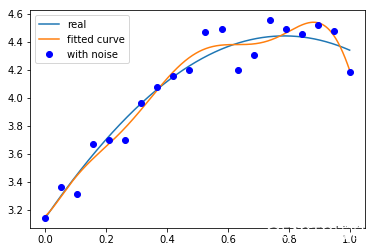
import numpy as np import scipy as sp import pylab as pl from scipy.optimize import leastsq#最小二乘法函数 n=9#多项式次数 #目标函数 def real_func(x): return np.pi*(np.sin(x)+np.cos(x))#pi*(sinx+cosx) #多项式函数 def fit_func(p,x): f=np.poly1d(p) return f(x) #残差函数 def residuals_func(p,y,x): ret=fit_func(p,x)-y return ret x=np.linspace(0,1,20)#随机选择20个点作为x y_=real_func(x) y=[np.random.normal(0,0.1)+y for y in y_]#人为增加噪声 x_=np.linspace(0,1,1000) p_init=np.random.randn(n)#初始参数值 plsq=leastsq(residuals_func,p_init,args=(y,x))#最小二乘法 print("参数:",plsq[0]) pl.plot(x_,real_func(x_),label="real") pl.plot(x_,fit_func(plsq[0],x_),label="fitted curve") pl.plot(x,y,'bo',label='with noise') pl.legend() pl.show()参数: [ 5.66429153e+02 -2.31267133e+03 3.74497872e+03 -3.05872688e+03
1.32282723e+03 -2.91138157e+02 2.74425970e+01 1.90086912e+00
3.15467158e+00]
