1.函数说明
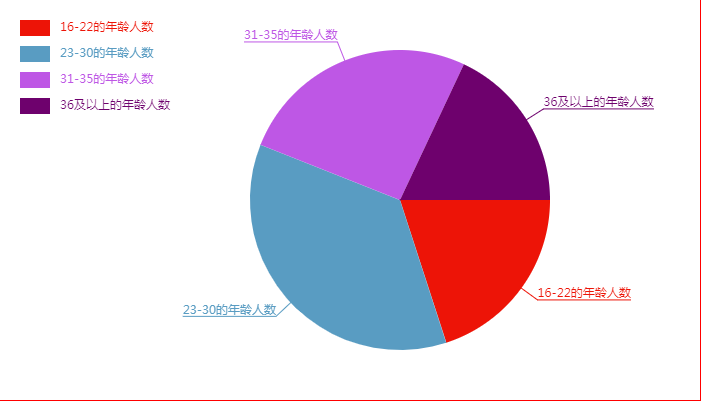
封装一个根据数据来绘制带说明的饼图的函数(插件),具体的功能包括:
随机颜色获取
各区间角度值的计算
扇形绘制(包括延长线及说明)
左上角颜色说明
画布建议大小为700 * 400
传入的数据格式为:
var data = [
    {num:"10",title:"16-22的年龄人数"},
    {num:"15",title:"23-30的年龄人数"},
    {num:"25",title:"31-35的年龄人数"},
    {num:"10",title:"36及以上的年龄人数"}
]
2.调用函数绘制饼图
<!DOCTYPE html>
<html>

<head>
    <meta charset="UTF-8">
    <title>Test</title>
    <script src="index.js"></script>
    <style>
        .box{
            width: 700px;
            height: 400px;
            margin: 20px auto;
        }
        .box > canvas{
            border:1px solid red;
        }
    </style>
</head>
<body>
    <div class="box">
        <canvas width="700" height="400"></canvas>
    </div>
</body>
<script>
    var canvas = document.querySelector("canvas")
    var ctx = canvas.getContext("2d")

    var data = [
        {num:0,title:"16-22的年龄人数"},
        {num:0,title:"23-30的年龄人数"},
        {num:0,title:"31-35的年龄人数"},
        {num:0,title:"36及以上的年龄人数"}
    ]

    //模拟数据(产生50个数据)
    var num = 50
    for(var i=0;i<num;i++){
        //随机产生16-40的整数
        var age = Math.floor(16 + Math.random()*25)
        if(age < 23){
            data[0].num++
        }else if(age < 31){
            data[1].num++
        }else if(age < 36){
            data[2].num++
        }else{
            data[3].num++
        }
    }

    //创建饼图对象
    var pieChart = new PieChart(ctx)
    //传入数据开始绘制饼图
    pieChart.init(data)
</script>
3.封装函数的代码
var PieChart = function(ctx) {
    this.ctx = ctx || document.querySelector('canvas').getContext("2d");
    this.w = this.ctx.canvas.width;
    this.h = this.ctx.canvas.height;
    //饼图的圆心
    this.x0 = this.w / 2 + 50;
    this.y0 = this.h / 2;
    this.r = 150; //半径
    //延长线的长度
    this.outLineWidth = this.r + 20;
    //说明矩形的大小
    this.rectW = 30;
    this.rectH = 16;
    this.space = 20;
}
PieChart.prototype.init = function(data) {
    this.drawPie(data);
}
PieChart.prototype.drawPie = function(data) {
    var angleList = this.transitionRadian(data);
    var startRadian = 0; //起始角度
    var rectY = this.space; //说明矩形的起始Y坐标
    for (var i = 0; i < angleList.length; i++) {
        //绘制扇形
        this.ctx.beginPath(); //开启路径
        //获取随机颜色
        var color = this.getRandomColor();
        this.ctx.fillStyle = color; //设置填充颜色
        //结束弧度 = 上一个区间的弧度 + 此区间所占的弧度
        var endRadian = startRadian + angleList[i].angle;
        this.ctx.arc(this.x0, this.y0, this.r, startRadian, endRadian);
        this.ctx.lineTo(this.x0, this.y0);
        this.ctx.fill();

        //绘制饼图的延长线标题
        this.drawTitle(startRadian, endRadian, angleList[i].title, color);

        //绘制左上角颜色说明
        this.drawDesc(rectY, color, angleList[i].title);

        //更新prevDadian
        startRadian = endRadian;
        //更新矩形的起始Y坐标
        rectY += (this.rectH + 10);
    }
}
PieChart.prototype.drawTitle = function(startRadian, endRadian, title, color) {
    //计算中心角度
    var middleRadian = (startRadian + endRadian) / 2;
    //以outLineWidth为直角边
    //根据正弦 余弦求出两个边的长度,再结合圆心的坐标,求出延长线两点的坐标
    var outX = this.x0 + this.outLineWidth * Math.cos(middleRadian);
    var outY = this.y0 + this.outLineWidth * Math.sin(middleRadian);
    //设置字体(设置字体要在计算字体宽度之前)
    this.ctx.font = '12px 微软雅黑';
    //设置文字基线
    this.ctx.textBaseline = 'bottom';
    //设置描边颜色
    this.ctx.strokeStyle = color;
    //计算下划线的终点坐标及文字对齐方式
    if (outX >= this.x0) {
        //在右边
        var underlineX = outX + this.ctx.measureText(title).width;
        this.ctx.textAlign = 'left';
    } else {
        //在左边
        var underlineX = outX - this.ctx.measureText(title).width;
        this.ctx.textAlign = 'right';
    }
    //绘制延长线
    this.ctx.beginPath();
    this.ctx.moveTo(this.x0, this.y0);
    this.ctx.lineTo(outX, outY);
    this.ctx.lineTo(underlineX, outY);
    this.ctx.stroke();

    //绘制文本
    this.ctx.beginPath();
    this.ctx.fillText(title, outX, outY);
}

//绘制左上角的说明
PieChart.prototype.drawDesc = function(rectY, color, title) {
    this.ctx.beginPath();
    this.ctx.textAlign = 'left';
    //中线对齐
    this.ctx.textBaseline = 'middle';
    //绘制矩形
    this.ctx.fillRect(this.space, rectY, this.rectW, this.rectH);
    //绘制文字,文字的基点y坐标为矩形的垂直方向的中心
    this.ctx.fillText(title, this.space + this.rectW + 10, rectY + this.rectH / 2);
}

//为每个区间添加角度属性
PieChart.prototype.transitionRadian = function(data) {
    //获取统计的总人数
    var total = 0;
    for (var i = 0; i < data.length; i++) {
        total += data[i].num;
    }
    for (var i = 0; i < data.length; i++) {
        var angle = 2 * Math.PI * Number(data[i].num) / total;
        data[i].angle = angle;
    }
    return data;
}

//获取随机颜色
PieChart.prototype.getRandomColor = function() {
    var r = Math.round(Math.random() * 255);
    var g = Math.round(Math.random() * 255);
    var b = Math.round(Math.random() * 255);
    return 'rgb(' + r + ',' + g + ',' + b + ')';
}
4.效果图
