x <- c(18,23,25,35,65,54,34,56,72,19) # build X(predictor)
y <- c(202,168,180,156,169,174,172,153,199,193) # build Y(dependent variable)
mode(x) # view the type of x
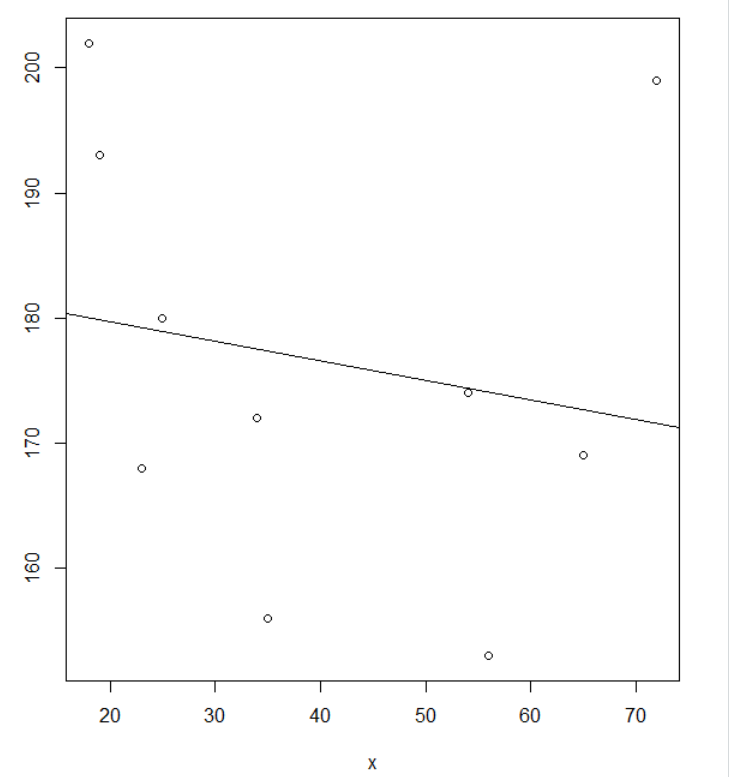
plot(x,y) # plot the graph
model <- lm(y ~ x) # build the linear model
abline(model) # add the line in graph

数据是自己编的,所以图有点假。
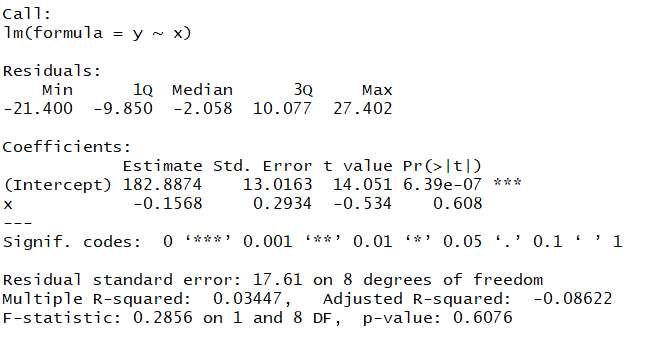
summary(model)

上图为各种参数,还有各种检验。
如果想要输出建好的模型的方程的话,可以以下面的方式,当然还可以用predict()函数
pridict <- model$coefficients[1] + model$coefficients[1]*100 # we can pridict 100 in model through this way
print(pridict) # print result
来源:https://www.cnblogs.com/zijidefengge/p/11939428.html