部分转载自:https://blog.csdn.net/daniel960601/article/details/79121055
圆周率π是一个无理数,没有任何一个精确公式能够计算π值,π的计算只能采用近似算法。
国际公认的π值计算采用蒙特卡洛方法。
一、蒙特卡洛方法
蒙特卡洛(Monte Carlo)方法,又称随机抽样或统计试验方法。当所求解的问题是某种事件出现的概率,或某随机变量的期望值时,可以通过某种“试验”方法求解。
简单说,蒙特卡洛是利用随机试验求解问题的方法。
二、π值的计算
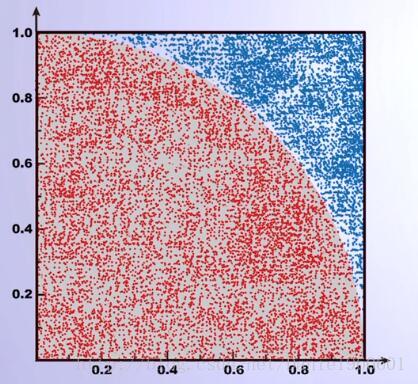
构造一个单位正方形和一个单位圆的1/4,往整个区域内随机投入点,根据点到原点的距离判断点是落在1/4的圆内还是在圆外,从而根据落在两个不同区域的点的数目,求出两个区域的比值。如此一来,就可以求出1/4单位圆的面积,从而求出圆周率π。 
1. 简化版PI 求解的Python实现(示例一):
# pi.py
from random import random
from math import sqrt
from time import clock

DARTS = 12000        # 总的实验次数
hits = 0
clock()
for i in range(1, DARTS):
    x, y = random(), random();
    dist = sqrt(x**2 + y**2)
    if dist <= 1.0:
        hits = hits + 1
pi = 4 * (hits/DARTS)
print('Value of PI is %s' % pi)
print('Total runtime : %-5.5ss' % clock())
代码中用到了random和math库的random()函数和sqrt()函数,为了统计时间,还用到了time库的clock()函数。
投入的点越多,计算值越精确。
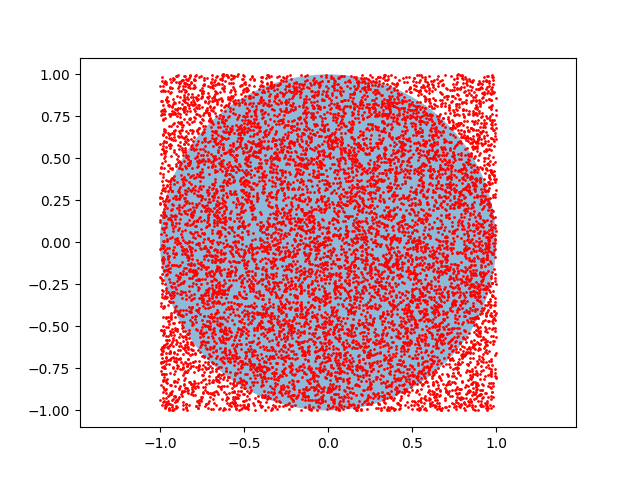
2. 另一个改进版的 Python 程序(示例二):
用正方形及其内接圆开展投针实验
# PI-pro2.py

import numpy as np
import matplotlib.pyplot as plt
from matplotlib.patches import Circle

# 投针次数
n = 10000

# 圆的信息
r = 1.0         # 半径
a, b = (0., 0.) # 圆心

# 正方形区域边界
x_min, x_max = a-r, a+r
y_min, y_max = b-r, b+r

# 在正方形区域内随机投点,(x,y)构成 n 个点
x = np.random.uniform(x_min, x_max, n)   # 均匀分布
y = np.random.uniform(y_min, y_max, n)

# 计算 点到圆心的距离
d = np.sqrt((x-a)**2 + (y-b)**2)

# 统计 落在圆内的点的数目
res = sum(np.where(d < r, 1, 0))

# 计算 PI 的近似值(Monte Carlo方法的精髓:用统计值去近似真实值)
pi = 4 * res / n

print('pi: ', pi)

# 画个图看看
fig = plt.figure()
axes = fig.add_subplot(111)
axes.plot(x, y,'ro',markersize = 1)
plt.axis('equal') # 防止图像变形

circle = Circle(xy=(a,b), radius=r, alpha=0.5)
axes.add_patch(circle)

plt.show()
示例二次运行截图:

3. 另一个改进版的 Python 程序(示例三):
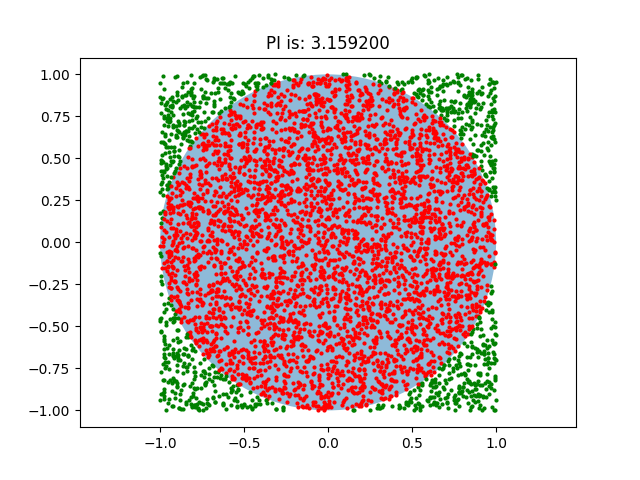
改进了示例二的图形显示:
- (1)圆内外的点采用不同颜色显示;
- (2)增加了图的标题,用于展示 PI的计算结果
# PI-pro3.py

import numpy as np
import matplotlib.pyplot as plt
from matplotlib.patches import Circle

# 投点次数
n = 5000

# 圆的信息
r = 1.0         # 半径
a, b = (0., 0.) # 圆心

# 正方形区域边界
x_min, x_max = a-r, a+r
y_min, y_max = b-r, b+r

# 在正方形区域内随机投点
x = np.random.uniform(x_min, x_max, n) # 均匀分布
y = np.random.uniform(y_min, y_max, n)

# 计算 点到圆心的距离
d = np.sqrt((x-a)**2 + (y-b)**2)

# 统计 落在圆内的点的数目
ind = np.where(d <= r, 1, 0)
res = sum(ind)

# 计算 pi 的近似值(Monte Carlo方法的精髓:用统计值去近似真实值)
pi = 4 * res / n

print('pi: ', pi)

# 画个图看看,画图比较耗费时间
fig = plt.figure()
axes = fig.add_subplot(111)
axes.set_title('PI is: %f'  %pi)    # 在图中标题栏显示计算的 PI值

for i in range(len(ind)):
	if ind[i] == 1:
		axes.plot(x[i], y[i],'ro',markersize = 2,color='r')  # 圆内一种颜色
	else:
		axes.plot(x[i], y[i],'ro',markersize = 2,color='g')  # 圆外另一种颜色

plt.axis('equal') # 防止图像变形

circle = Circle(xy=(a,b), radius=r, alpha=0.5)
axes.add_patch(circle)

plt.show()
示例三次运行截图: 
三、结语
蒙特卡洛方法提供了一个利用计算机中随机数和随机试验来解决现实中无法用公式求解问题的思路,广泛应用在金融工程学、宏观经济学、计算物理学等领域。
四、Uniform 均匀分布投针方法
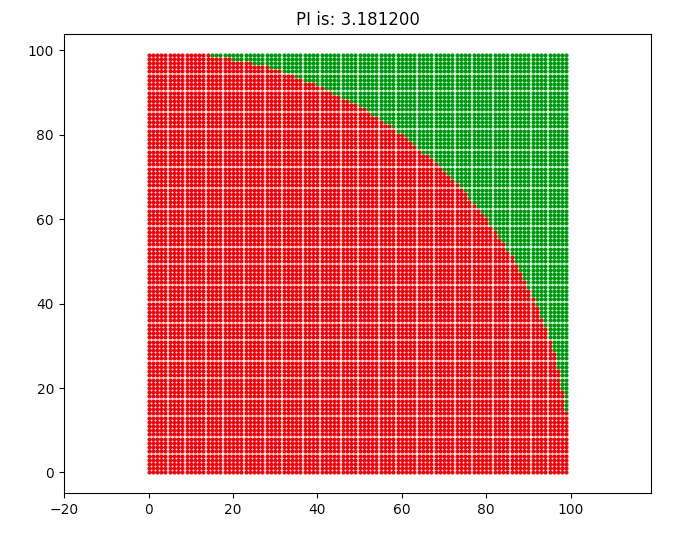
我采用均匀布点的方法,投针,计算弧线内的点数 N,全部投针数比值的4倍近似求 PI
import matplotlib.pyplot as plt
from matplotlib.patches import Circle

# 初始化
N = 0
K = 0
step = 1
r = 100   # 半径

# 画图
fig = plt.figure()
axes = fig.add_subplot(111)

for x in range(0,r,step):
	for y in range(0,r,step):
		if (x**2+y**2 <= r**2):
			N = N +1
			axes.plot(x, y,'ro',markersize = 2,color='r')  # 圆内一种颜色
		else:
		    K = K +1
		    axes.plot(x, y,'ro',markersize = 2,color='g')  # 圆外一种颜色

PI = 4 * N / (N+K)
print('PI : ', PI)

axes.set_title('PI is: %f'  %PI)    # 在图中标题栏显示计算的 PI值
plt.axis('equal') # 防止图像变形

plt.show()
示例 投10000个针,运行截图: 
从上图可以看出,Monte Carlo 方法投5000针计算所得的精度高于 uniform 投针10000次的进度。
来源:oschina
链接:https://my.oschina.net/u/4263245/blog/3860351