R语言基础知识:


 简单线性回归
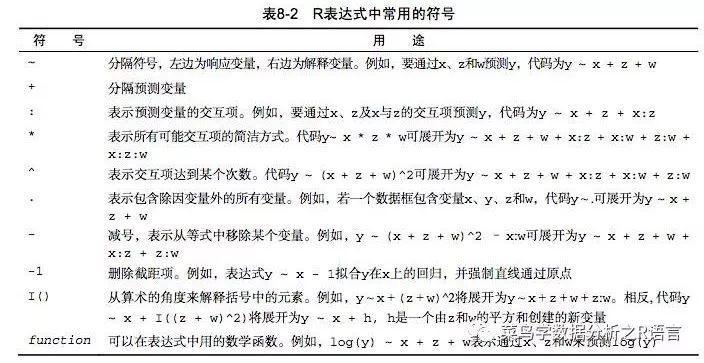
> fit <- lm(weight ~height,data=women)
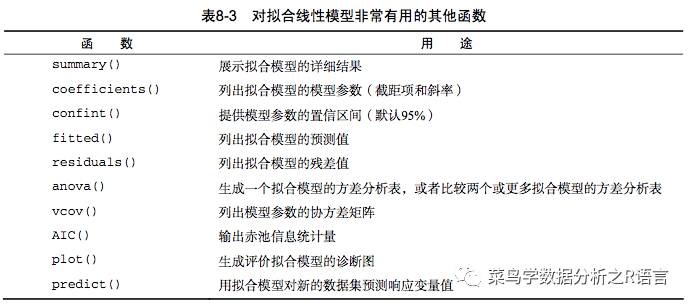
> summary(fit)
Call:
lm(formula = weight ~ height, data = women)
Residuals:
Min 1Q Median 3Q Max
-1.7333 -1.1333 -0.3833 0.7417 3.1167
Coefficients:
Estimate Std. Error t value Pr(>|t|)
(Intercept) -87.51667 5.93694 -14.74 1.71e-09 ***
height 3.45000 0.09114 37.85 1.09e-14 ***
---
Signif. codes: 0 ‘***’ 0.001 ‘**’ 0.01 ‘*’ 0.05 ‘.’ 0.1 ‘ ’ 1
Residual standard error: 1.525 on 13 degrees of freedom
Multiple R-squared: 0.991, Adjusted R-squared: 0.9903
F-statistic: 1433 on 1 and 13 DF, p-value: 1.091e-14
> women$weight
[1] 115 117 120 123 126 129 132 135 139 142 146 150 154 159 164
> fitted(fit)
1 2 3 4 5 6 7 8 9 10
112.5833 116.0333 119.4833 122.9333 126.3833 129.8333 133.2833 136.7333 140.1833 143.6333
11 12 13 14 15
147.0833 150.5333 153.9833 157.4333 160.8833
> residuals(fit)
1 2 3 4 5 6 7
2.41666667 0.96666667 0.51666667 0.06666667 -0.38333333 -0.83333333 -1.28333333
8 9 10 11 12 13 14
-1.73333333 -1.18333333 -1.63333333 -1.08333333 -0.53333333 0.01666667 1.56666667
15
3.11666667
> plot(women$height,women$weight,xlab="Height(in inpches",ylab = "Weight(in pounds")
> abline(fit)
 公式:
公式:
因为身高不可能为0,它仅仅是一个常量调整整 。在Pr(>|t|) ,可以看到回归系数(3.45)显著不为0(p<0.001),表明身高每增高1英寸 体重将预期增加3.45磅 ,R平方 (0.991)表明模型可以解释体 99.1%的方差,它也是实际和预测之间的相关系数(R2 = r2YY)。残差标准 (1.53 lbs) 可认为是模型用身高预测体重的平均误差。F统计检验量所有的预测响应量预测量是否都在某个几水平之上。由于简单回归只有一个预测边量,此 F检验等同于身高回归系数的t 检验。
##数据来源:《R语言实战》
本文分享自微信公众号 - 菜鸟学数据分析之R语言(lxl915746437)。
如有侵权,请联系 support@oschina.cn 删除。
本文参与“OSC源创计划”,欢迎正在阅读的你也加入,一起分享。
来源:oschina
链接:https://my.oschina.net/u/4627940/blog/4550439