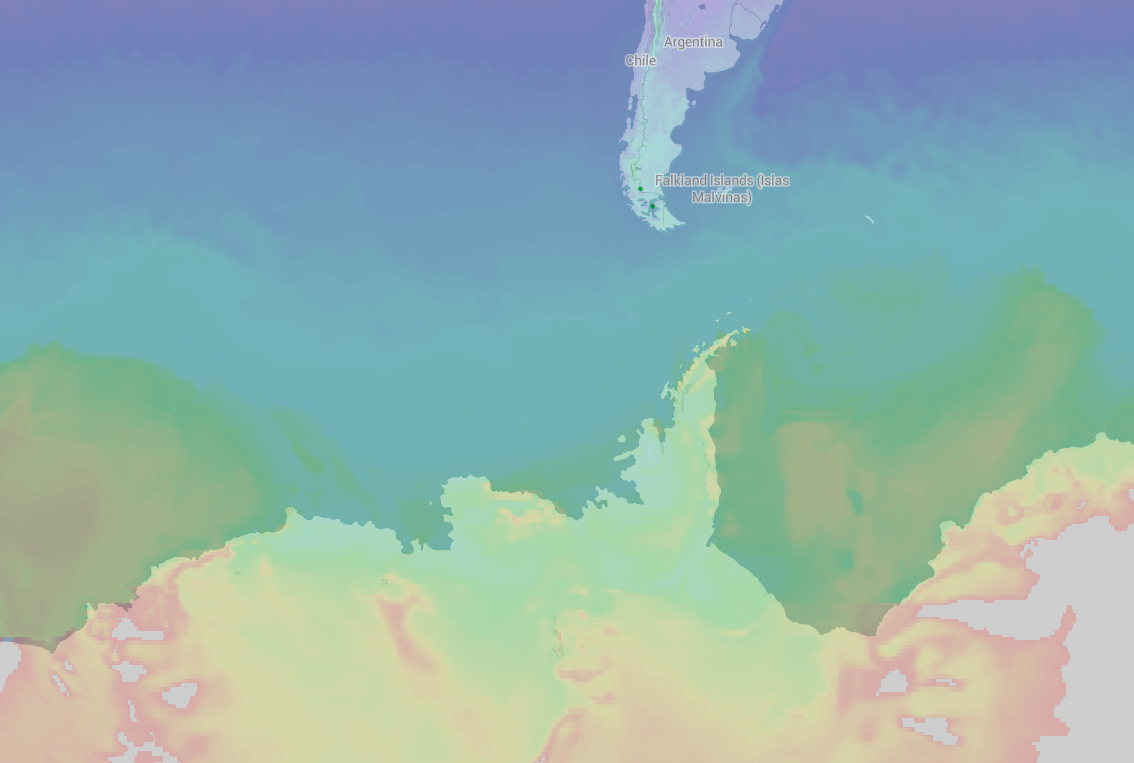
We at Ubilabs recently had the opportunity to inspect the internal workings of Mapbox GL JS, because we wanted to add some functionality to it. Mapbox did an amazing job with their implementation, still for our specific use case we had to fork and extend the library:
Our goal was to implement a data-driven raster layer.
Mapbox already includes a raster layer type, which can be used to render raster tiles to the map, e.g. for sattelite imagery. Also it offers a point layer, which can style its point color based on the underlying data, hence the term data-driven. We wanted to combine these features: Color raster tiles based on their data value (more on that below).We had to reasons for this:
- Be flexible on the colorization of the tiles: The normal approach to render raster tiles is to completely pre-render them on the server and produce finished up images, with the correct coloring etc. To make the rendering configurable you put a lot of work on the server and generate specially colored tiles which may only be need that one time. That’s a lot of time wasted especially if a lot of clients want a lot of differing configurations. So we wanted to move this step on the client-side.
- Minimize data traffic to the client: Turns out that if you have lot of raster layers which receive pre-rendered tiles as their sources from their server, you will end up with a load of requests for relatively big image files. Mapbox does a good job caching these, still we wanted to lower this generated traffic, because we actually have to render a lot of raster data over the span of a session.
Of course we didn’t just want to display any other raster tile. Data types we wanted to render included things like temperature, precipitation and cloud coverage, which are inherently raster data types. Also the underlying data is recalculated very frequently, which is the main reason to push the tile rendering off to the client side. This splits calculating and displaying the data nicely between server and client.
Rendering Raster Layers
So what are the basics of rendering raster tiles in Mapbox? Actually there is a lot to it, but it comes down to this:
Based on zoom level and bounding box of the map the necessary tiles will be requested from the tile server (or come from the cache). Mapbox will create WebGL textures from the image blobs, in order to have access to them in the raster fragment shader (What’s a shader?). This is what the simplified version of said shader looks like:
Not really relevant to this post, but nevertheless pretty cool: The cross-fade happening on line 8 enables a smooth transition between the discrete zoom levels of the raster tiles. Mapbox has continuous zoom because it makes use of vector tiles, but the raster tiles you have are only available at certain discrete zoom levels (like 0, 1, 2..20). So the shader takes two textures, the one for the parent tile, which is the tile for the zoom level above the current one, and the one for the current zoom level. Based on the zoom position between the two zoom levels it takes a certain “amount of color” from the parent tile and the “remaining” amount of color from the child tile (basically it interpolates linearly between the two colors). So when your zoom value equals 10.75 you get: child-color * 0.75 + parent-color * 0.25.
Simple trick for an awesome result.
Reducing Traffic with Data Tiles

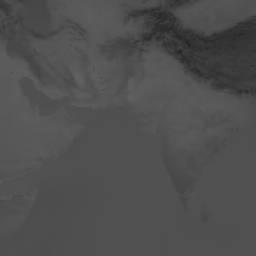
A grey-scale raster tile
As we aren’t coloring our raster tiles on the server, we have to get the information or “data values” down to the client side in some way. We experimented with a lot of different approaches: JPEG, JPEGmini, PNGquant etc.. We knew that it would be sufficient to offer a relatively small value range and that the compression should be lossless. This landed us on the standard PNG format, we put some optimization into it and ended up with grey-scale tiles. So for every pixel all color channels include the same value. PNG compression works really well with grey values as it uses a palette-based approach, where it builds up a color-palette of colors of the original picture and later only references the palette indices for the separate pixel color values. You can also cut of the alpha-channel and remove some meta data from the PNG header to save a few bytes.
With the data tiles in place we just need to tell the client how the grey values are mapped to the actual values they represent, e.g. a temperature value. So you end up with a color value range from 0 to 255 which translates to a given data value range, e.g. temperature values from -50°C to 50°C.
Mapping values to colors
The mapping between the data values and the color happens inside the fragment shader. To make this possible some pre-calculation needs to be done:
- Define a value-to-color mapping: We do this with a simple function which receives a data value as its argument and should return a color string like this one: rgba(0, 0, 0, 1.0). This is just your normal RGBA string which you might know from CSS, things like hsla also work. Inside of the function you can do whatever you want to generate this string (as long as it happens synchronously).
- Generate a look up texture:
This will create a canvas element and draw up the colors for every data value we got. This will result in a 256 by 1 texture, which looks something likes this:

10x1 px color texture
We don’t need to actually render this anywhere to the screen to have the texture available to use.
The Fragment Shader
Now with these steps done we can update the old raster fragment shader and use our generated texture as a simple look-up table, without doing some big calculations or interpolations:
DONE!
We now are totally flexible to configure the color mapping on the client side and the performance overhead of creating the look-up texture once per layer is minimal compared to pre-rendering every raster tile on the server side.

BAM: pretty colored raster tiles
I hope you enjoyed the read! Visit us at www.ubilabs.net or on Twitter @ubilabs. And props to the guys at @Mapbox for creating awesome and fun to work with open source libraries!
Some resources:
- Book of Shaders
- mapbox-gl-js
- mapbox-gl-shaders
- Amazing Talk by Vladimir Agafonkin about Mapbox GL internals at FOSS4G 2016
- Me on Twitter
来源:oschina
链接:https://my.oschina.net/u/205735/blog/3035423