湖北省:
import requests
from pyecharts.charts import *
from pyecharts import options as opts

url = "https://lab.isaaclin.cn/nCoV/api/area"
data = requests.get(url).json()
for item in data["results"]:
    if item["provinceShortName"] == "湖北":
        hb_data = item["cities"]
hb_bar = (
        Bar(init_opts=opts.InitOpts(theme = "dark"))
        .add_xaxis([hd["cityName"] for hd in hb_data])
        .add_yaxis("累计确诊人数", [hd["confirmedCount"] for hd in hb_data])
        .add_yaxis("累计治愈人数", [hd["curedCount"] for hd in hb_data])
        .reversal_axis()
        .set_series_opts(label_opts=opts.LabelOpts(is_show = False))
        .set_global_opts(
            title_opts=opts.TitleOpts(title="湖北各市新冠疫情确诊及治愈人数对比nntttttttttttttttttttt------哈佛哥出品"),
            legend_opts=opts.LegendOpts(is_show = True)
                )
        )
# hb_bar.render(path='湖北新冠疫情图.html')
hb_bar.render_notebook()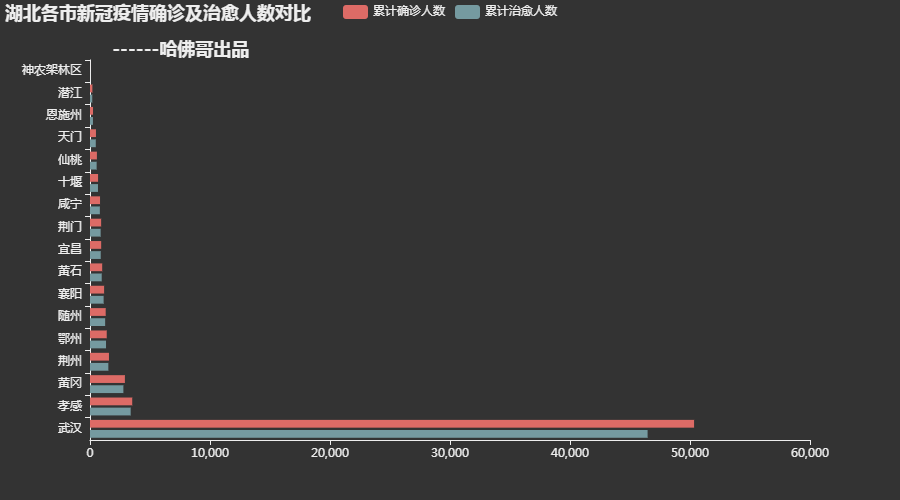
广东省:
import requests
from pyecharts.charts import *
from pyecharts import options as opts

url = "https://lab.isaaclin.cn/nCoV/api/area"
data = requests.get(url).json()
for item in data["results"]:
    if item["provinceShortName"] == "广东":
        hb_data = item["cities"]
hb_bar = (
        Bar(init_opts=opts.InitOpts(theme = "dark"))
        .add_xaxis([hd["cityName"] for hd in hb_data])
        .add_yaxis("累计确诊人数", [hd["confirmedCount"] for hd in hb_data])
        .add_yaxis("累计治愈人数", [hd["curedCount"] for hd in hb_data])
        .reversal_axis()
        .set_series_opts(label_opts=opts.LabelOpts(is_show = False))
        .set_global_opts(
            title_opts=opts.TitleOpts(title="广东各市新冠疫情确诊及治愈人数对比nntttttttttttttttttttt------哈佛哥出品"),
            legend_opts=opts.LegendOpts(is_show = True)
                )
        )
# hb_bar.render(path='广东新冠疫情图.html')
hb_bar.render_notebook()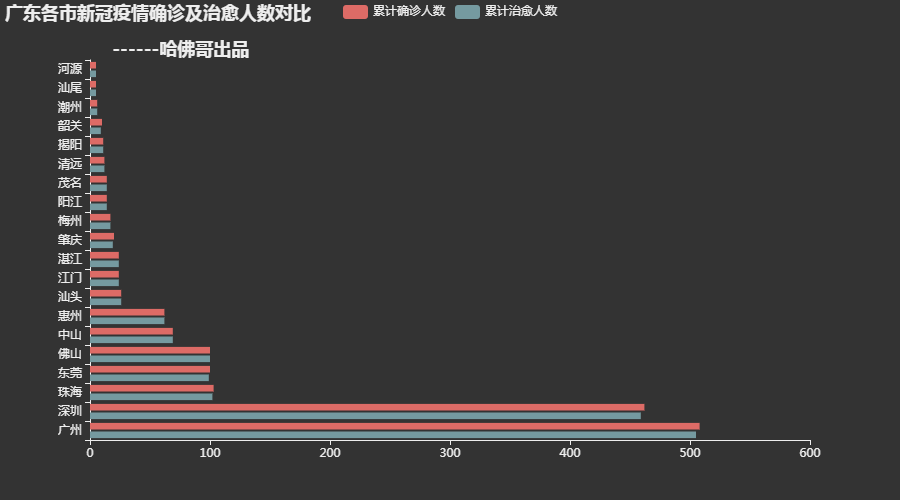
广西壮族自治区:
import requests
from pyecharts.charts import *
from pyecharts import options as opts

url = "https://lab.isaaclin.cn/nCoV/api/area"
data = requests.get(url).json()
for item in data["results"]:
    if item["provinceShortName"] == "广西":
        hb_data = item["cities"]
hb_bar = (
        Bar(init_opts=opts.InitOpts(theme = "dark"))
        .add_xaxis([hd["cityName"] for hd in hb_data])
        .add_yaxis("累计确诊人数", [hd["confirmedCount"] for hd in hb_data])
        .add_yaxis("累计治愈人数", [hd["curedCount"] for hd in hb_data])
        .reversal_axis()
        .set_series_opts(label_opts=opts.LabelOpts(is_show = False))
        .set_global_opts(
            title_opts=opts.TitleOpts(title="广西各市新冠疫情确诊及治愈人数对比nntttttttttttttttttttt------哈佛哥出品"),
            legend_opts=opts.LegendOpts(is_show = True)
                )
        )
# hb_bar.render(path='广西新冠疫情图.html')
hb_bar.render_notebook()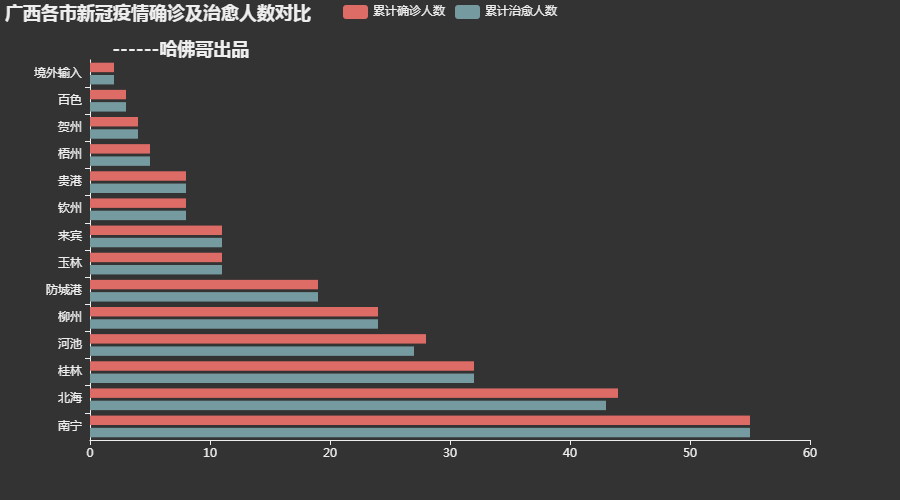
黑龙江:
import requests
from pyecharts.charts import *
from pyecharts import options as opts

url = "https://lab.isaaclin.cn/nCoV/api/area"
data = requests.get(url).json()
for item in data["results"]:
    if item["provinceShortName"] == "黑龙江":
        hb_data = item["cities"]
hb_bar = (
        Bar(init_opts=opts.InitOpts(theme = "dark"))
        .add_xaxis([hd["cityName"] for hd in hb_data])
        .add_yaxis("累计确诊人数", [hd["confirmedCount"] for hd in hb_data])
        .add_yaxis("累计治愈人数", [hd["curedCount"] for hd in hb_data])
        .reversal_axis()
        .set_series_opts(label_opts=opts.LabelOpts(is_show = False))
        .set_global_opts(
            title_opts=opts.TitleOpts(title="黑龙江各市新冠疫情确诊及治愈人数对比nntttttttttttttttttttt------哈佛哥出品"),
            legend_opts=opts.LegendOpts(is_show = True)
                )
        )
# hb_bar.render(path='黑龙江新冠疫情图.html')
hb_bar.render_notebook()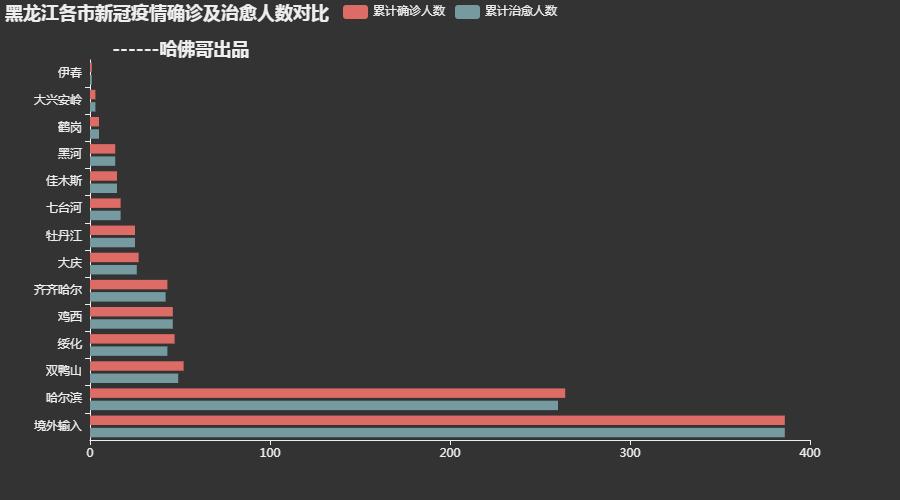
重庆:
import requests
from pyecharts.charts import *
from pyecharts import options as opts

url = "https://lab.isaaclin.cn/nCoV/api/area"
data = requests.get(url).json()
for item in data["results"]:
    if item["provinceShortName"] == "重庆":
        hb_data = item["cities"]
hb_bar = (
        Bar(init_opts=opts.InitOpts(theme = "dark"))
        .add_xaxis([hd["cityName"] for hd in hb_data])
        .add_yaxis("累计确诊人数", [hd["confirmedCount"] for hd in hb_data])
        .add_yaxis("累计治愈人数", [hd["curedCount"] for hd in hb_data])
        .reversal_axis()
        .set_series_opts(label_opts=opts.LabelOpts(is_show = False))
        .set_global_opts(
            title_opts=opts.TitleOpts(title="重庆各区新冠疫情确诊及治愈人数对比nntttttttttttttttttttt------滕玉龙出品"),
            legend_opts=opts.LegendOpts(is_show = True)
                )
        )
# hb_bar.render(path='重庆各区新冠疫情图.html')
hb_bar.render_notebook()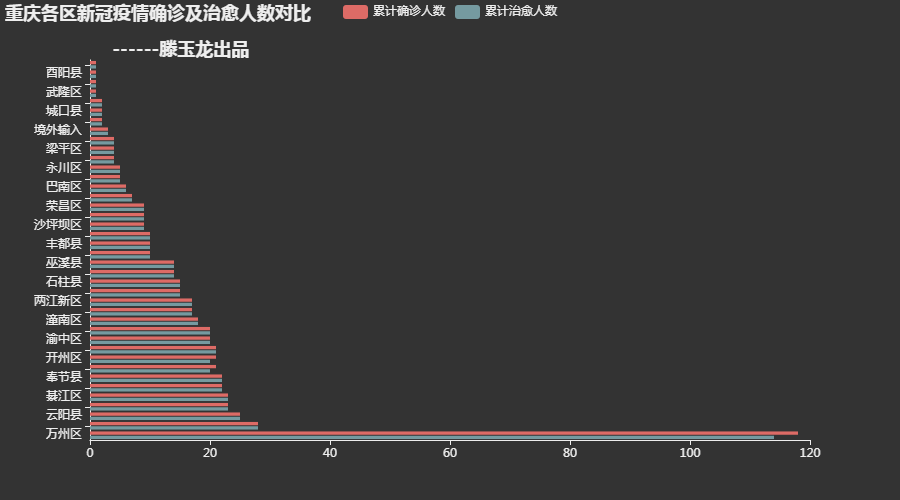
来源:oschina
链接:https://my.oschina.net/u/3750423/blog/4294175