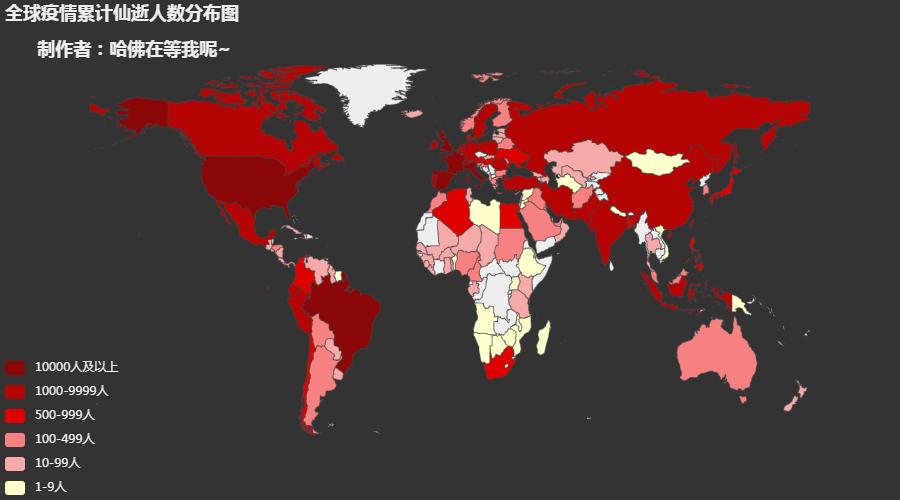
代码:
import requests
from pyecharts.charts import *
from pyecharts import options as opts

url = "https://lab.isaaclin.cn/nCoV/api/area"
data = requests.get(url).json()
oversea_confirm = []
for item in data["results"]:
    if item["countryEnglishName"]:
        oversea_confirm.append((item["countryEnglishName"]
                                .replace("United States of America", "United States")
                                .replace("United Kiongdom", "United Kingdom"),
                                item["deadCount"]))
world_map = (
        Map(init_opts=opts.InitOpts(theme = "dark"))
        .add("累计死亡人数", oversea_confirm, "world",is_map_symbol_show = False, is_roam = False)
        .set_series_opts(label_opts=opts.LabelOpts(is_show = False, color = "#fff"))
        .set_global_opts(
            title_opts=opts.TitleOpts(title = "全球疫情累计仙逝人数分布图nntttttt制作者:哈佛在等我呢~"),
            legend_opts=opts.LegendOpts(is_show = False),
            visualmap_opts=opts.VisualMapOpts(max_ = 2700,
                                              is_piecewise = True,
                                              pieces=[
                                                {"max": 99999, "min": 10000, "label": "10000人及以上", "color": "#8A0808"},
                                                {"max": 9999, "min": 1000, "label": "1000-9999人", "color": "#B40404"},
                                                {"max": 999, "min": 500, "label": "500-999人", "color": "#DF0101"},
                                                {"max": 499, "min": 100, "label": "100-499人", "color": "#F78181"},
                                                {"max": 99, "min": 10, "label": "10-99人", "color": "#F5A9A9"},
                                                {"max": 9, "min": 0, "label": "1-9人", "color": "#FFFFCC"},
                                              ])
        )
    )
# world_map.render(path='全球疫情地图.html')
world_map.render_notebook()
运行结果:

来源:oschina
链接:https://my.oschina.net/u/3750423/blog/4293064