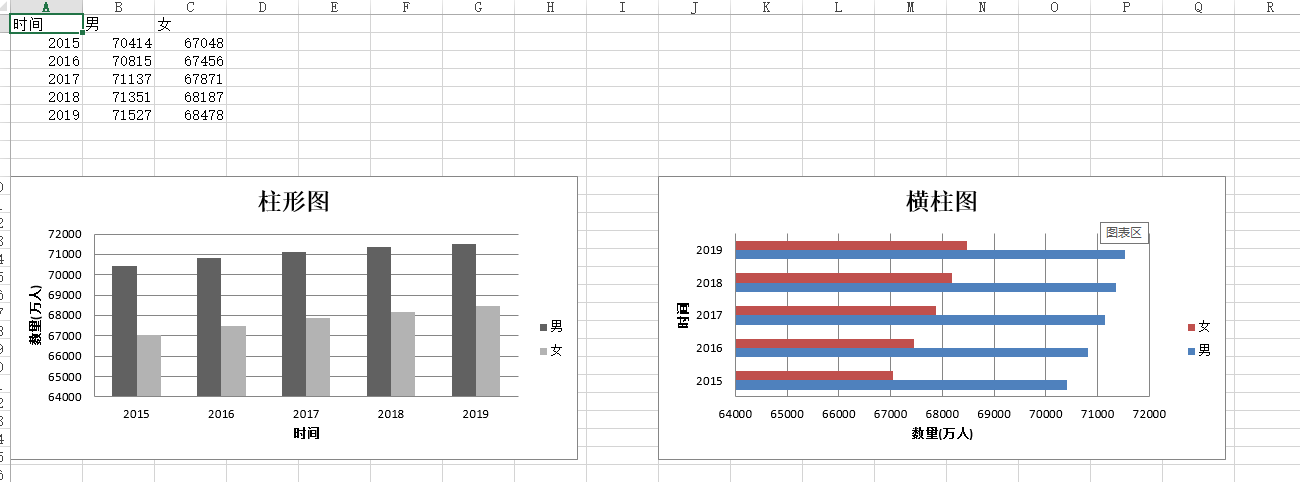
使用openpyxl生成包含echarts柱形图的Excel文件
效果图如下:

代码如下:
from openpyxl import Workbook
from openpyxl.chart import BarChart, Series, Reference

wb = Workbook(write_only=True)
ws = wb.create_sheet()

rows = [
    ('时间', '男', '女'),
    (2015, 70414, 67048),
    (2016, 70815, 67456),
    (2017, 71137, 67871),
    (2018, 71351, 68187),
    (2019, 71527, 68478)
]

for row in rows:
    ws.append(row)

chart1 = BarChart()
chart1.type = "col"
chart1.style = 1
chart1.title = "柱形图"
chart1.y_axis.title = '数量(万人)'
chart1.x_axis.title = '时间'

data = Reference(ws, min_col=2, min_row=1, max_row=6, max_col=3)
cats = Reference(ws, min_col=1, min_row=2, max_row=6)
chart1.add_data(data, titles_from_data=True)
chart1.set_categories(cats)
chart1.shape = 3
ws.add_chart(chart1, "A10")

from copy import deepcopy

chart2 = deepcopy(chart1)
chart2.style = 2
chart2.type = "bar"
chart2.title = "横柱图"
ws.add_chart(chart2, "J10")

chart3 = deepcopy(chart1)
chart3.type = "col"
chart3.style = 3
chart3.grouping = "stacked"
chart3.overlap = 100
chart3.title = '堆叠柱形图'
ws.add_chart(chart3, "A27")

chart4 = deepcopy(chart1)
chart4.type = "bar"
chart4.style = 4
chart4.grouping = "percentStacked"
chart4.overlap = 100
chart4.title = '百分比堆叠柱形图'
ws.add_chart(chart4, "J27")

wb.save("bar.xlsx")
来源:oschina
链接:https://my.oschina.net/qinghuo111/blog/4270672