基本理论
Correlation
Are there correlations between variables?
Correlation measures the strength of the linear association between two numerical variables. For example, you could imagine that for children, age correlates with height: the older the child, the taller he or she is. You could reasonably expect to get a straight line or upward curve with a positive slope when you plot age against height.
定义

生物是一个有机的整体,其各个组成部分都是相关联的,我们可以通过研究一个生物的牙齿、爪子或者骨骼来复原这个生物。
协方差:
定义:

对于离散型随机变量:

对于连续性随机变量:

协方差化简:

当X与Y独立时, 有Cov(X, Y) = 0
协方差基本性质:

随机变量和的方差与协方差的关系:
D(X +/- Y) = D(X) + D(Y) +/- 2Cov(X, Y)
协方差的有界性

相关系数:
定义


Python3NumPy关于相关性协方差阐述
导入相关模块
import numpy as np
from matplotlib.pyplot import plot
from matplotlib.pyplot import show
import matplotlib.pyplot as plt
导入数据
bhp = np.loadtxt('BHP.csv', delimiter=',', usecols=(6,), unpack=True)数据BHP.csv文件如下:
| BHP |
11-02-2011 |
93.11 |
94.26 |
92.9 |
93.72 |
1741900 |
|
| BHP |
14-02-2011 |
94.57 |
96.23 |
94.39 |
95.64 |
2620800 |
|
| BHP |
15-02-2011 |
94.45 |
95.47 |
93.91 |
94.56 |
2461300 |
|
| BHP |
16-02-2011 |
92.67 |
93.58 |
92.56 |
93.3 |
3270900 |
|
| BHP |
17-02-2011 |
92.65 |
93.98 |
92.58 |
93.93 |
2650200 |
|
| BHP |
18-02-2011 |
92.34 |
93 |
92 |
92.39 |
4667300 |
|
| BHP |
22-02-2011 |
93.14 |
93.98 |
91.75 |
92.11 |
5359800 |
|
| BHP |
23-02-2011 |
91.93 |
92.46 |
91.05 |
92.36 |
7768400 |
|
| BHP |
24-02-2011 |
92.42 |
92.71 |
90.93 |
91.76 |
4799100 |
|
| BHP |
25-02-2011 |
93.48 |
94.04 |
92.44 |
93.91 |
3448300 |
|
| BHP |
28-02-2011 |
94.81 |
95.11 |
94.1 |
94.6 |
4719800 |
|
| BHP |
01-03-2011 |
95.05 |
95.2 |
93.13 |
93.27 |
3898900 |
|
| BHP |
02-03-2011 |
93.89 |
94.89 |
93.54 |
94.43 |
3727700 |
|
| BHP |
03-03-2011 |
95.9 |
96.11 |
95.18 |
96.02 |
3379400 |
|
| BHP |
04-03-2011 |
96.12 |
96.44 |
95.08 |
95.76 |
2463900 |
|
| BHP |
07-03-2011 |
96.51 |
96.66 |
94.03 |
94.47 |
3590900 |
|
| BHP |
08-03-2011 |
93.72 |
94.47 |
92.9 |
94.34 |
3805000 |
|
| BHP |
09-03-2011 |
92.94 |
93.13 |
91.86 |
92.22 |
3271700 |
|
| BHP |
10-03-2011 |
89 |
89.17 |
87.93 |
88.31 |
5507800 |
|
| BHP |
11-03-2011 |
88.24 |
89.8 |
88.16 |
89.59 |
2996800 |
|
| BHP |
14-03-2011 |
88.17 |
89.06 |
87.82 |
89.02 |
3434800 |
|
| BHP |
15-03-2011 |
84.58 |
87.32 |
84.35 |
86.95 |
5008300 |
|
| BHP |
16-03-2011 |
86.31 |
87.28 |
83.85 |
84.88 |
7809799 |
|
| BHP |
17-03-2011 |
87.32 |
88.29 |
86.89 |
87.38 |
3947100 |
|
| BHP |
18-03-2011 |
89.53 |
89.58 |
88.05 |
88.56 |
3809700 |
|
| BHP |
21-03-2011 |
90.13 |
90.16 |
88.88 |
89.59 |
3098200 |
|
| BHP |
22-03-2011 |
89.5 |
89.59 |
88.42 |
88.71 |
3500200 |
|
| BHP |
23-03-2011 |
89.57 |
90.32 |
88.85 |
90.02 |
4285600 |
|
| BHP |
24-03-2011 |
90.86 |
91.35 |
89.7 |
91.26 |
3918800 |
|
| BHP |
25-03-2011 |
90.42 |
91.09 |
90.07 |
90.67 |
3632200 |
vale = np.loadtxt('VALE.csv', delimiter=',', usecols=(6,), unpack=True)数据VALE.csv文件如下:
| VALE |
11-02-2011 |
|
33.88 |
34.54 |
33.63 |
34.37 |
18433500 |
| VALE |
14-02-2011 |
|
34.53 |
35.29 |
34.52 |
35.13 |
20780700 |
| VALE |
15-02-2011 |
|
34.89 |
35.31 |
34.82 |
35.14 |
17756700 |
| VALE |
16-02-2011 |
|
35.16 |
35.4 |
34.81 |
35.31 |
16792800 |
| VALE |
17-02-2011 |
|
35.18 |
35.6 |
35.04 |
35.57 |
24088300 |
| VALE |
18-02-2011 |
|
35.31 |
35.37 |
34.89 |
35.03 |
21286600 |
| VALE |
22-02-2011 |
|
33.94 |
34.57 |
33.36 |
33.44 |
28364700 |
| VALE |
23-02-2011 |
|
33.43 |
34.12 |
33.1 |
33.94 |
22559300 |
| VALE |
24-02-2011 |
|
34.3 |
34.3 |
33.56 |
34.21 |
20591900 |
| VALE |
25-02-2011 |
|
34.67 |
34.95 |
34.05 |
34.27 |
20151500 |
| VALE |
28-02-2011 |
|
34.34 |
34.51 |
33.7 |
34.23 |
16126000 |
| VALE |
01-03-2011 |
|
34.39 |
34.44 |
33.68 |
33.76 |
17282400 |
| VALE |
02-03-2011 |
|
33.61 |
34.5 |
33.57 |
34.32 |
15870900 |
| VALE |
03-03-2011 |
|
34.77 |
34.89 |
34.53 |
34.87 |
14648200 |
| VALE |
04-03-2011 |
|
34.67 |
34.83 |
34.04 |
34.5 |
15330800 |
| VALE |
07-03-2011 |
|
34.43 |
34.53 |
32.97 |
33.23 |
25040500 |
| VALE |
08-03-2011 |
|
33.22 |
33.7 |
32.55 |
33.29 |
17093000 |
| VALE |
09-03-2011 |
|
33.23 |
33.44 |
32.68 |
32.88 |
20026300 |
| VALE |
10-03-2011 |
|
32.17 |
32.4 |
31.68 |
31.91 |
30803900 |
| VALE |
11-03-2011 |
|
31.53 |
32.42 |
31.49 |
32.17 |
24429900 |
| VALE |
14-03-2011 |
|
32.03 |
32.45 |
31.74 |
32.44 |
15525500 |
| VALE |
15-03-2011 |
|
30.99 |
31.93 |
30.79 |
31.91 |
24767700 |
| VALE |
16-03-2011 |
|
31.99 |
32.03 |
30.68 |
31.04 |
30394153 |
| VALE |
17-03-2011 |
|
31.44 |
31.82 |
31.32 |
31.51 |
24035000 |
| VALE |
18-03-2011 |
|
32.17 |
32.39 |
31.98 |
32.14 |
19740600 |
| VALE |
21-03-2011 |
|
32.81 |
32.85 |
32.26 |
32.42 |
18923700 |
| VALE |
22-03-2011 |
|
32.13 |
32.32 |
31.74 |
32.25 |
18934200 |
| VALE |
23-03-2011 |
|
32.39 |
32.91 |
32.22 |
32.7 |
18359900 |
| VALE |
24-03-2011 |
|
32.82 |
32.94 |
32.12 |
32.36 |
25894100 |
| VALE |
25-03-2011 |
|
32.26 |
32.74 |
31.93 |
32.34 |
16688900 |
数据处理:
bhp_returns = np.diff(bhp) / bhp[:-1]
vale_returns = np.diff(vale) / vale[:-1]
计算bhp_returns和vale_returns的协方差
covariance = np.cov(bhp_returns, vale_returns)
print(covariance)
结果:
[[0.00028179 0.00019766]
 [0.00019766 0.00030123]]
取协方差对角线上的元素:
print(covariance.diagonal())结果:
[0.00028179 0.00030123]打印协方差矩阵的迹:
print(covariance.trace())结果:
0.000583023549920278计算bhp_returns和vale_returns的相关系数:
print(covariance/((bhp_returns.std()*vale_returns.std())))结果:
[[1.00173366 0.70264666]
[0.70264666 1.0708476 ]]print(np.corrcoef(bhp_returns, vale_returns))结果:
[[1.         0.67841747]
 [0.67841747 1.        ]]
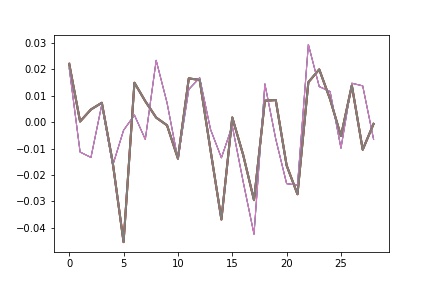
绘bhp_returns和vale_returns的图像:
t = np.arange(len(bhp_returns))
plot(t, bhp_returns, lw = 1)
plot(t, vale_returns,lw =2)
show()
结果:

相关知识点理解
np.diff(a, n=1, axis=-1)
import numpy as np
A = np.arange(2 , 14).reshape((3 , 4))
A[1 , 1] = 8
print('A:' , A)
# A: [[ 2 3 4 5]
# [ 6 8 8 9]
# [10 11 12 13]]
print(np.diff(A))
# [[1 1 1]
# [2 0 1]
# [1 1 1]]来源:oschina
链接:https://my.oschina.net/u/4320414/blog/3930387