1、图形标注
(1)图形标题
title(标题)
title(标题,属性名,属性值)
%% 图形标注
x = 0:0.11:2*pi;
y = sin(x);
plot(x,y);
title('y=sin(x)示范','color','r');
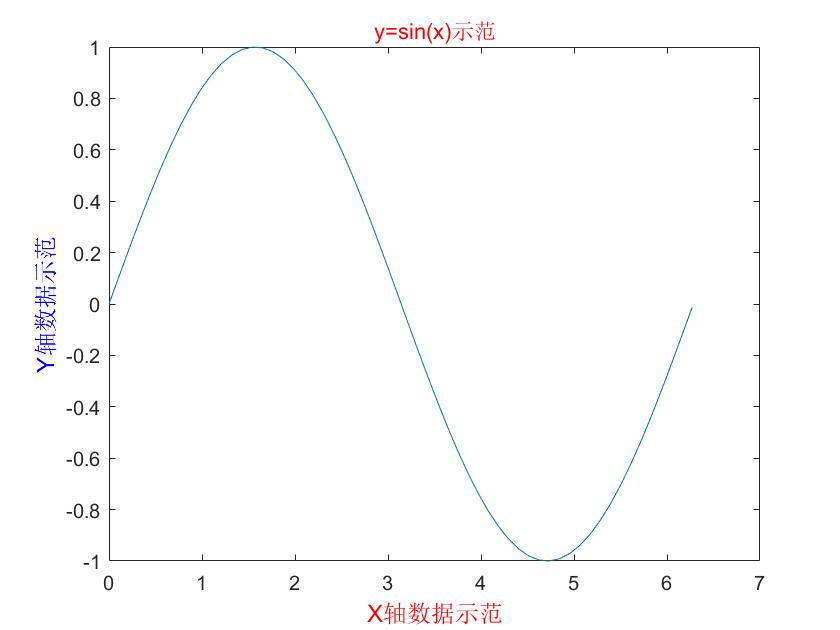
(2)坐标轴标签
xlabel(标签,属性名,属性值)
ylabel(标签,属性名,属性值)
%% 坐标轴标签
x = 0:0.11:2*pi;
y = sin(x);
plot(x,y);
xlabel('X轴数据示范','color','r','fontsize',12);
ylabel('Y轴数据示范','color','b','fontsize',12);
title('y=sin(x)示范','color','r');
(3)图例
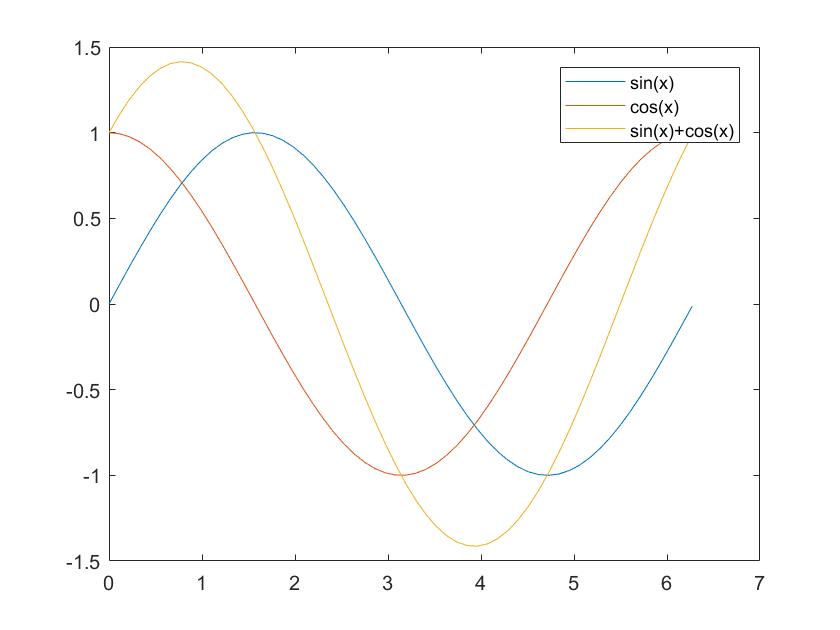
legend(图例说明)
%% 图例
x = 0:0.11:2*pi;
y1 = sin(x);
y2 = cos(x);
y3 = sin(x)+cos(x);
plot(x,[y1;y2;y3]);
legend('sin(x)','cos(x)','sin(x)+cos(x)');
2、特殊绘图
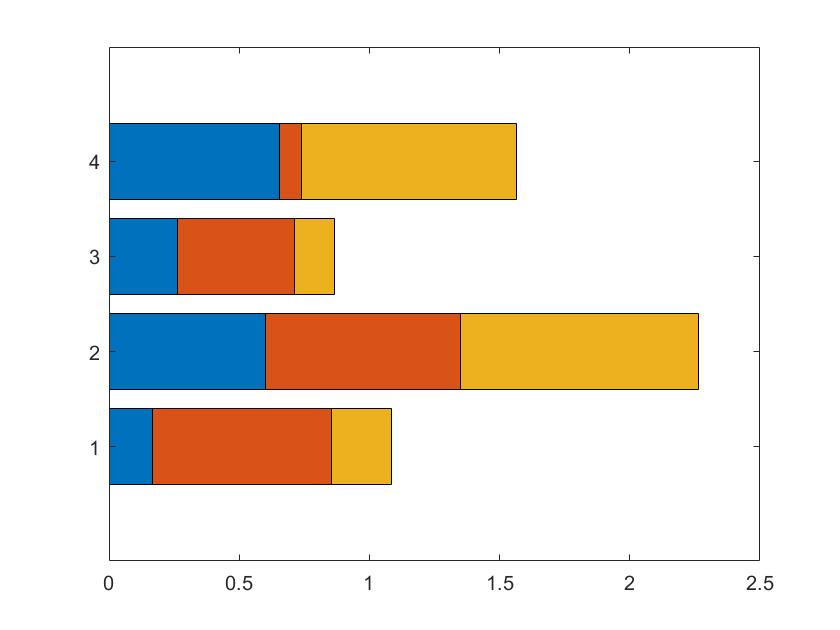
(1)柱状图bar
bar(y)
bar(x,y)
barh(x,y)
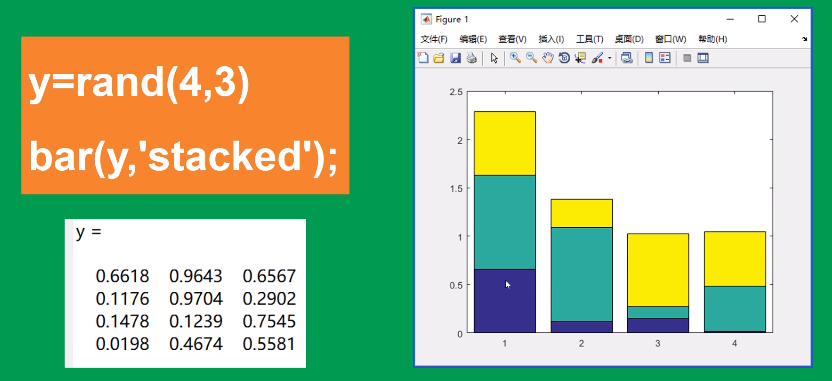
bar(y,'stacked') 堆积图
%% 柱状图
y = rand(5,3);
bar(y,0.5)
%% 柱状图
x = 101:110;
y = rand(1,10);
bar(x,y);

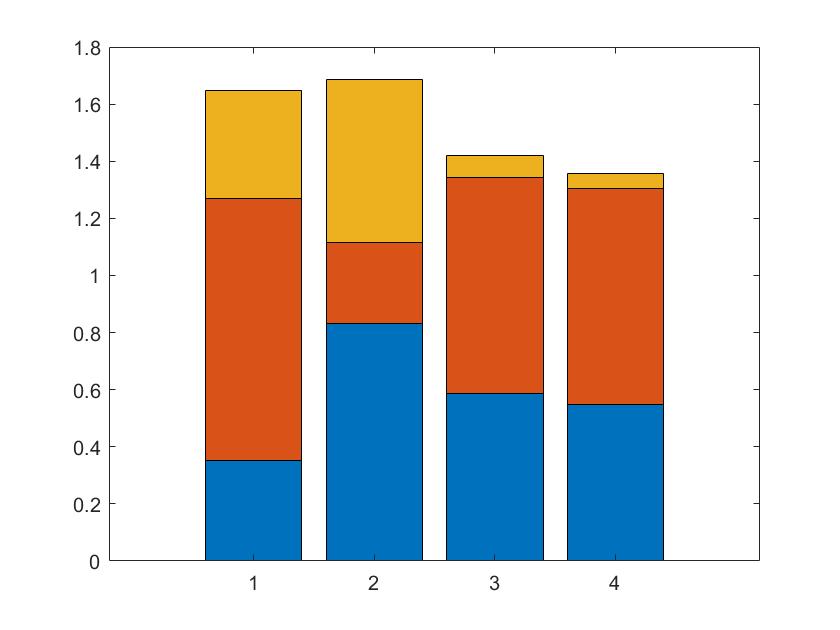
y = rand(4,3);
% bar(y,'stacked'); % 横向
barh(y,'stacked'); % 纵向
(2)面积图
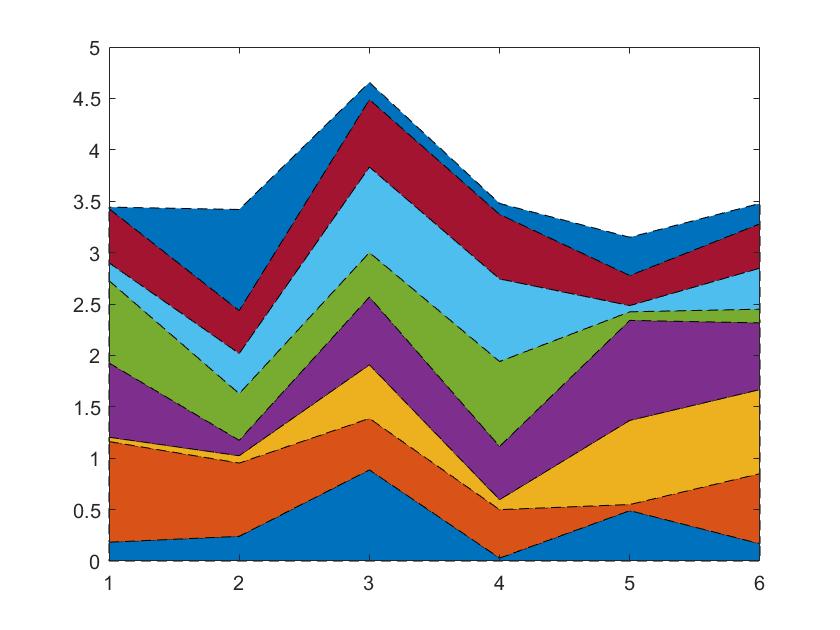
area(y)
area(y,属性名称,属性值)
%% 面积图
y = rand(6,8);
% area(y);
area(y,'linestyle','--');
(3)饼图pie
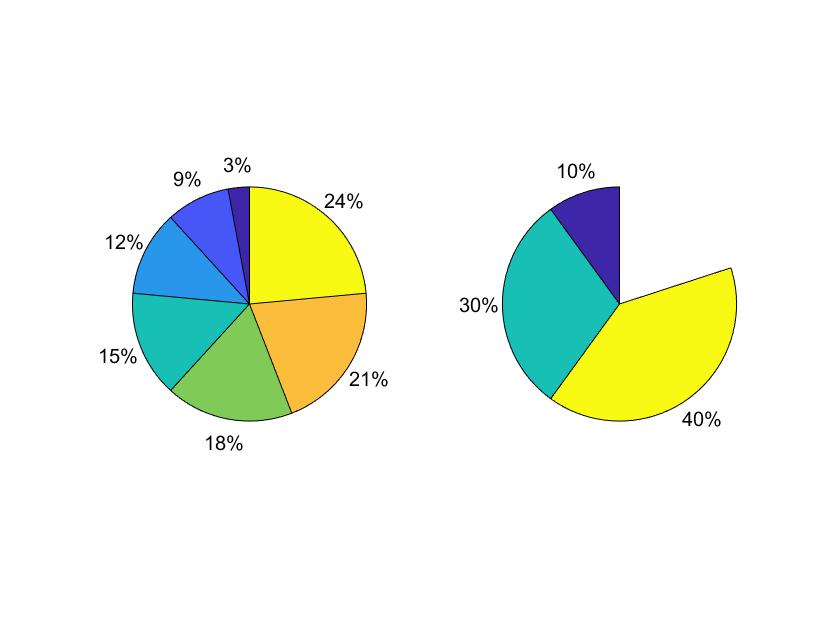
pie(数据)
数据和超过1,自动计算百分比;
数据和不超过1,直接绘制,其余部分空缺。
%% 饼图
a = [1,3,4,5,6,7,8];
subplot(1,2,1);pie(a);
b = [0.1,0.3,0.4];
subplot(1,2,2);pie(b);
(4)直方图hist
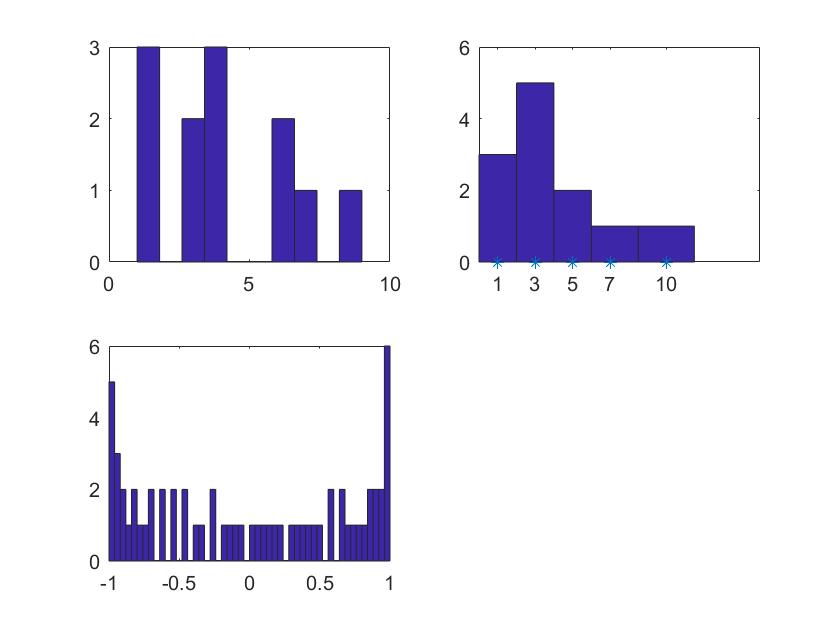
hist(数据)
hist(数据,分组个数)
hist(数据,X轴划分情况)
%% 直方图
a = [1,3,4,1,6,4,4,7,3,9,6,1];
subplot(2,2,1);hist(a);
subplot(2,2,2);hist(a,[1,3,5,7,10]);
x = 0:0.1:2*pi;
y = sin(x);
subplot(2,2,3);hist(y,50);
3、三维绘图
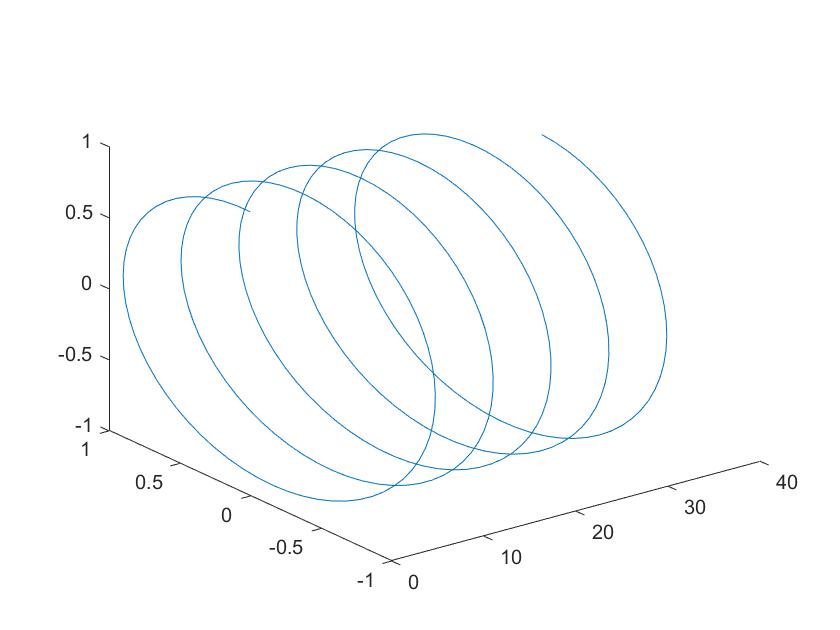
(1)三维曲线plot3
plot3(x,y,z)
%% 三维曲线
x = 0:0.1:10*pi;
y = sin(x);
z = cos(x);
plot3(x,y,z);
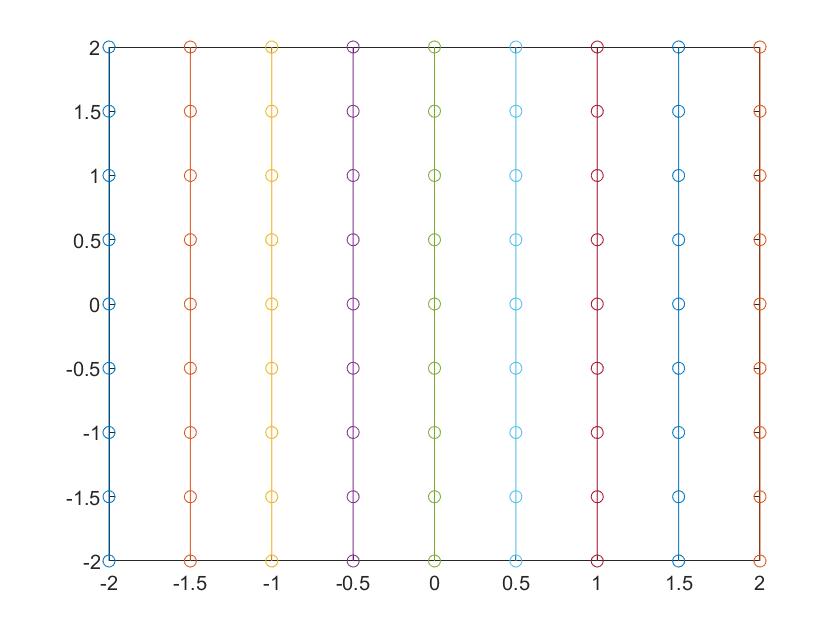
(2)三维曲线之矩形网格
[X,Y] = meshgrid(x,y)
%% 三维曲线之矩形网格
x = -2:0.5:2;
y = -2:0.5:2;
[X,Y] = meshgrid(x,y);
% [X,Y] = meshgrid(-2:0.5:2); % x,y一致的情况
plot(X,Y,'O-');
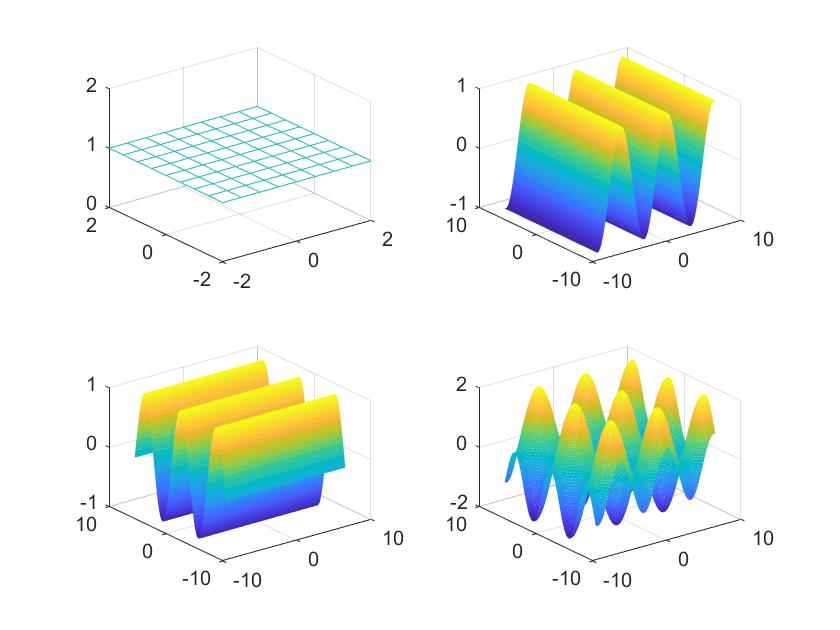
(3)三维曲面之mesh网格图
mesh(x,y,z)
%% 三维曲面之mesh网格图
[X1,Y1] = meshgrid(-2:0.5:2);
Z1 = ones(size(X));
subplot(2,2,1);mesh(X1,Y1,Z1);

[X2,Y2] = meshgrid(-8:0.1:8);
Z2 = sin(X2);
subplot(2,2,2);mesh(X2,Y2,Z2);

[X3,Y3] = meshgrid(-8:0.1:8);
Z3 = cos(Y3);
subplot(2,2,3);mesh(X3,Y3,Z3);

[X4,Y4] = meshgrid(-8:0.1:8);
Z4 = sin(X4)+cos(Y4);
subplot(2,2,4);mesh(X4,Y4,Z4);
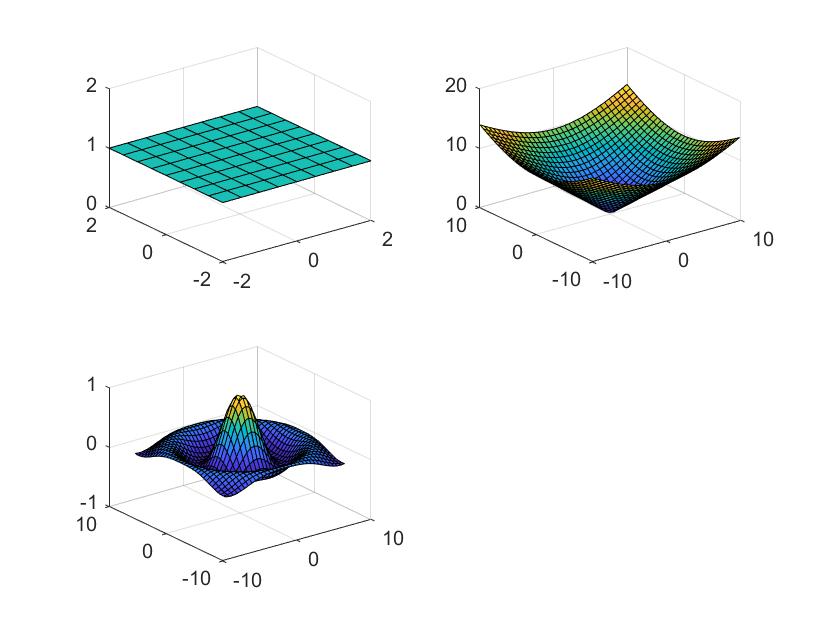
(4)三维曲面之表面图surf
surf(x,y,z)
%% 三维曲面
[X1,Y1] = meshgrid(-2:0.5:2);
Z1 = ones(size(X));
subplot(2,2,1);surf(X1,Y1,Z1);

[X2,Y2] = meshgrid(-10:0.6:10);
Z2 = sqrt(X2.^2+Y2.^2);
subplot(2,2,2);surf(X2,Y2,Z2);

[X3,Y3] = meshgrid(-8:0.5:8);
R = sqrt(X3.^2+Y3.^2);
Z3 = sin(R)./R;
subplot(2,2,3);surf(X3,Y3,Z3);
来源:https://www.cnblogs.com/fengxb1213/p/12640120.html