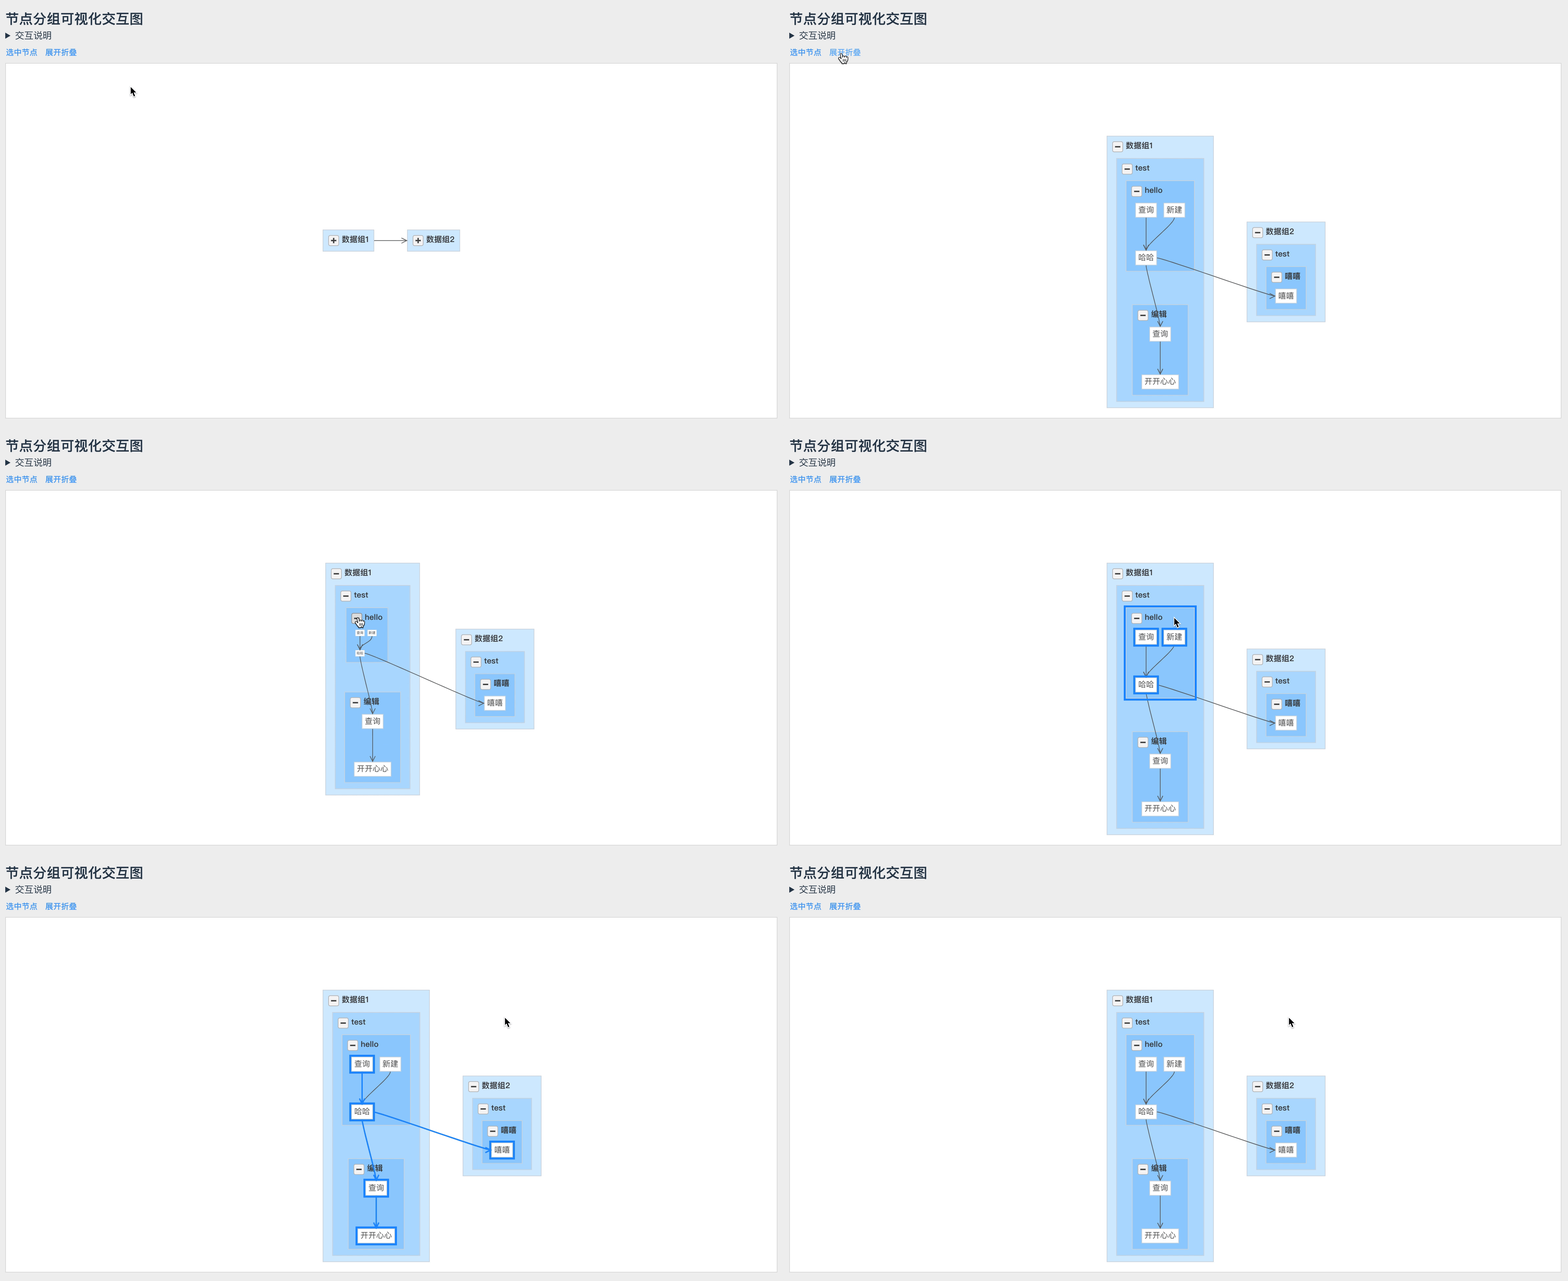
本文是关于如何使用可视化库 gojs 完成节点分组关系展示的,从零基础到实现最终效果。希望对使用 gojs 的小伙伴有帮助。
1. 节点分组需求及 demo 展示

需求
- 能正确展示组的层次,以及节点之间的关系。
- 单选节点、多选节点,获取到节点信息
- 选中组,能选中组中的节点,能获取到组中的节点信息
- 选中节点,当前节点视为根节点,能选中根节点连线下的所有节点,并获取到节点信息
2. 准备
- 从后端获取到的接口数据:
const data = {
  "properties": [
    { "key": "t-2272", "parentKey": "j-1051", "name": "哈哈" },
    { "key": "p-344", "parentKey": "g--1586357764", "name": "test" },
    { "key": "t-2271", "parentKey": "j-1051", "name": "查询" },
    { "key": "t-2275", "parentKey": "j-1052", "name": "开开心心" },
    { "key": "j-1054", "parentKey": "p-344", "name": "嘻嘻" },
    { "key": "t-2274", "parentKey": "j-1052", "name": "查询" },
    { "key": "j-1051", "parentKey": "p-444", "name": "hello" },
    { "key": "j-1052", "parentKey": "p-444", "name": "编辑" },
    { "key": "t-2281", "parentKey": "j-1054", "name": "嘻嘻" },
    { "key": "p-444", "parentKey": "g--1586357624", "name": "test" },
    { "key": "g--1586357624", "name": "数据组1" },
    { "key": "g--1586357764", "name": "数据组2" },
    { "key": "t-2273", "parentKey": "j-1051", "name": "新建" }
  ],
  "dependencies": [
    { "sourceKey": "t-2272", "targetKey": "t-2274" },
    { "sourceKey": "t-2274", "targetKey": "t-2275" },
    { "sourceKey": "t-2273", "targetKey": "t-2272" },
    { "sourceKey": "t-2271", "targetKey": "t-2272" },
    { "sourceKey": "t-2272", "targetKey": "t-2281" }
  ]
}
- 参考 gojs demo:grouping、 navigation
3. 实现步骤1:数据组建
gojs 图表实例所需数据结构如下:
diagram.model = new go.GraphLinksModel(
    [ // node data
        { key: "A"},
        { key: "F", group: "Omega"},
        { key: "G"},
        { key: "Chi", isGroup: true },
    ],
    [  // link data
        { from: "A", to: "A" },
        { from: "F", to: "G" },
        { from: "G", to: "Chi"}
    ]
);
根据接口数据构建出的最终数据如下:
node
[
{ "key": "g--1586357624", "text": "数据组1", "type": "g", "isGroup": true },
{ "key": "p-444", "text": "test", "type": "p", "isGroup": true, "group": "g--1586357624" },
{ "key": "j-1051", "text": "hello", "type": "j", "isGroup": true, "group": "p-444" },
{ "key": "t-2272", "text": "哈哈", "type": "t", "group": "j-1051" },
{ "key": "t-2271", "text": "查询", "type": "t", "group": "j-1051" },
{ "key": "t-2273", "text": "新建", "type": "t", "group": "j-1051" },
{ "key": "j-1052", "text": "编辑", "type": "j", "isGroup": true, "group": "p-444" },
{ "key": "t-2275", "text": "开开心心", "type": "t", "group": "j-1052" },
{ "key": "t-2274", "text": "查询", "type": "t", "group": "j-1052" },
{ "key": "g--1586357764", "text": "数据组2", "type": "g", "isGroup": true },
{ "key": "p-344", "text": "test", "type": "p", "isGroup": true, "group": "g--1586357764" },
{ "key": "j-1054", "text": "嘻嘻", "type": "j", "isGroup": true, "group": "p-344" },
{ "key": "t-2281", "text": "嘻嘻", "type": "t", "group": "j-1054" }
]
link
[ { "from": "t-2272", "to": "t-2274", "nextLinks": [ "t-2274", "t-2275" ] }, { "from": "t-2274", "to": "t-2275", "nextLinks": [ "t-2275" ] }, { "from": "t-2273", "to": "t-2272", "nextLinks": [ "t-2272", "t-2274", "t-2275" ] }, { "from": "t-2271", "to": "t-2272", "nextLinks": [ "t-2272", "t-2274", "t-2275" ] }, { "from": "t-2272", "to": "t-2281", "nextLinks": [ "t-2281" ] } ]如何根据接口数据组装出所需数据就不介绍了。text字段用于显示组及节点的标题,nextLinks是为后面做选中当前节点,能选中节点连线下的所有节点做数据准备。
大家如果感兴趣,可以先不读后面的,自己根据组装出的数据自己实现下后面的交互。
4. 实现步骤2:构建图表容器、实例,自定义布局、节点、连线、组的样式等属性。
- 容器
<div class="diagram" id="diagram"></div>
- 去除水印、画布蓝色边框,参考前篇
- 构建图表实例
import * as go from './go-module.js';

const $ = go.GraphObject.make;
    const diagram = $(go.Diagram,
        'diagram', // diagram 绘图容器的 id
        {
          layout: $(go.TreeLayout, // 布局方式
            {
              angle: 90, // 自上而下,0 从左到右
              arrangement: go.TreeLayout.ArrangementHorizontal
            }
          )
        }
    );
- 自定义节点、连线、组
const config = {
  borderColor: '#d1d9e2',
  groupTextColor: '#444',
  nodeTextColor: '#585858',
  linkColor: '#666',
  selectedLinkColor: '#2090ff',
}
图表颜色值统一管理。
定义节点
    diagram.nodeTemplate = $(go.Node,
        "Auto",
        $(go.Shape, "Rectangle", // 节点形状:矩形
          { stroke: config.borderColor, // 边框颜色
            strokeWidth: 1, // 边框宽度
            fill: "white", // 形状填充颜色
          },
        ),
        $(go.TextBlock, // 节点文本
          { margin: 4,
            stroke: config.nodeTextColor // 文本颜色
          },
          new go.Binding("text", "text"), // 将 model 中的 text 属性进行绑定,用于节点显示文本
        ),
        { doubleClick: nodeDblClick, // 节点双击事件,选中节点下的所有节点
        },
    );
定义边
    diagram.linkTemplate = $(go.Link,
        {
          curve: go.Link.Bezier // 贝塞尔曲线
        },
        // 连线
        $(go.Shape, { name: 'link', strokeWidth: 1, stroke: config.linkColor }),
        // 连线的箭头
        $(go.Shape, { name: 'linkArrow', toArrow: "OpenTriangle", stroke: config.linkColor })
    );
定义组
    diagram.groupTemplate = $(go.Group,
        "Auto",
        { // 定义分组的内部布局
          layout: $(go.TreeLayout,
            { angle: 90, arrangement: go.TreeLayout.ArrangementHorizontal }),
          isSubGraphExpanded: false, // 默认展开true、折叠false
          // 分组单击事件
          click: (e, group) => {
            // todo 实现组选中,选中组中所有节点
          }
        },
        $(go.Shape, // 定义分组形状及描述
          "Rectangle",
          {
            parameter1: 14,
            fill: "rgba(2, 153, 255, .2)", // 填充色
            stroke: config.borderColor, // 边框色
            strokeWidth: 1,
          },
        ),
        $(go.Panel, "Vertical",
          { defaultAlignment: go.Spot.Left, margin: 4 },
          $(go.Panel, "Horizontal",
            { defaultAlignment: go.Spot.Top, margin: 4 },
            $("SubGraphExpanderButton"), // 设置收缩按钮,用于展开折叠子图
            $(go.TextBlock, // 定义文本
              {
                alignment: go.Spot.TopLeft,
                font: "Bold 12px Sans-Serif",
                stroke: config.groupTextColor,
              },
              new go.Binding("text"), // 将 model 中的 text 属性进行绑定,用于节点显示文本
            )
          ),
          // 创建占位符来表示组内容所在的区域
          $(go.Placeholder, { padding: new go.Margin(5, 10) })
        )
    )
- 绑定数据
diagram.model = new go.GraphLinksModel(
    [], // nodes
    [] // links
)
5. 实现步骤3:交互处理
选中分组交互相对简单,就不附上代码了。
选中节点,选中节点连线下的所有节点
    function nodeDblClick (e, node) {
      // 遍历每一条边进行设置
      let goneNodes = []; // 记录遍历过的,避免再次遍历它
      const forEdges = (edges, isSelected) => {
        edges.forEach(edge => {
          if (edge && edge.nextLinks) { // 当前节点下面有多个节点
            edge.nextLinks.forEach((id, i) => {
              if (!goneNodes.includes(id)) { // 避免遍历过的
                goneNodes.push(id);
                const node = diagram.findNodeForKey(id);
                node.isSelected = isSelected;
                highlightLink(node, node.isSelected);
                // 递归设置节点连线上下游的每一个节点选中及连线高亮,linkArr 为前面组装出的图的边数据
                forEdges(linkArr.filter(e => e.from === id), isSelected)
              }
            })
          }
        })
      }

      const {key: nodeId} = node.data;
      // 存在多条边,linkArr 为前面组装出的图的边数据
      const edges = linkArr.filter(e => e.from === nodeId);
      // 先清除上次高亮的连线
      clearHightLink();
      // 高亮当前节点的连线
      highlightLink(node, node.isSelected);

      // 循环设置当前节点连线上下游的每一个节
      点选中及连线高亮
      forEdges(edges, node.isSelected);
    }
优化:思路:先统计数据,再对统计数据进行UI处理。职责分明,增强可读性。
function nodeDblClick (e, node) {
  // 遍历每一条边
  let allNodes = []; // 统计连线上的所有节点
  const forEdges = (edges) => {
    edges.forEach(edge => {
      if (edge && edge.nextLinks) { // 当前节点下面有多个节点
        edge.nextLinks.forEach((id, i) => {
          allNodes.push(id);
          // 递归节点连线上下游的每一个节点,linkArr 为前面组装出的图的边数据
          forEdges(linkArr.filter(e => e.from === id))
        })
      }
    })
  }

  const {key: nodeId} = node.data;
  // 存在多条边,linkArr 为前面组装出的图的边数据
  const edges = linkArr.filter(e => e.from === nodeId);
  // 循环统计当前节点连线上下游的每一个节点
  forEdges(edges);

  // 先清除上次高亮的连线
  clearHightLink();

  // 先统计出所有的,再去重,再对节点进行处理
  // 设置统计出的连线上的所有节点及边高亮
  allNodes.push(nodeId);
  allNodes = [...new Set(allNodes)]; // 去重
  allNodes.forEach(id => {
    const node = diagram.findNodeForKey(id);
    node.isSelected = true;
    highlightLink(node, true);
  })
}
clearHightLink 方法:清除连线高亮
highlightLink 方法:根据node获取到对应的id找出node的出去的线设置颜色等高亮。
最后
完成这个效果难点在哪,我自己的感受是:
- 组装数据:如何组装出图表所需的数据,特别是选中节点要选中节点连线下的所有节点,怎么组装数据才方便后面的处理。
- 在自定义布局、节点、连线、组属性及样式上,特别是细节处理,需要大量翻看文档指南或api,查看案例是等,确定哪个属性的哪个值改了才是需要的。
- 在做交互时,需要理清思路,看文档事件相关的部分。特别难的是,节点信息打印出来查看时,看不到具体的,只能看出来是 迭代器,可以遍历,但看不出具体的数据,只能通过相应 api 才能得到。
关于本文的代码,只放了核心部分的。
最后的最后,有不到位的地方或者错误的地方,亦或是更好的意见,欢迎指出。
非常感谢!!!
来源:https://www.cnblogs.com/EnSnail/p/12444499.html