一、实验文档准备
1、安装 tushare
pip install tushare
2、启动ipython
C:\Users\Administrator>ipython
Python 3.7.0 (default, Jun 28 2018, 08:04:48) [MSC v.1912 64 bit (AMD64)]
Type 'copyright', 'credits' or 'license' for more information
IPython 7.0.1 -- An enhanced Interactive Python. Type '?' for help.
3、ts.get_k_data使用帮助
In [1]: import tushare as ts

In [2]: ts.get_k_data?
Signature: ts.get_k_data(code=None, start='', end='', ktype='D', autype='qfq', index=False, retry_count=3, pause=0.001)
Docstring:
获取k线数据
---------
Parameters:
  code:string
              股票代码 e.g. 600848
  start:string
              开始日期 format:YYYY-MM-DD 为空时取上市首日
  end:string
              结束日期 format:YYYY-MM-DD 为空时取最近一个交易日
  autype:string
              复权类型,qfq-前复权 hfq-后复权 None-不复权,默认为qfq
  ktype:string
              数据类型,D=日k线 W=周 M=月 5=5分钟 15=15分钟 30=30分钟 60=60分钟,默认为D
  retry_count : int, 默认 3
             如遇网络等问题重复执行的次数
  pause : int, 默认 0
            重复请求数据过程中暂停的秒数,防止请求间隔时间太短出现的问题
return
-------
  DataFrame
      date 交易日期 (index)
      open 开盘价
      high  最高价
      close 收盘价
      low 最低价
      volume 成交量
      amount 成交额
      turnoverratio 换手率
      code 股票代码
File:      c:\programdata\anaconda3\lib\site-packages\tushare\stock\trading.py
Type:      function
4、获取股票信息
In [3]: df = ts.get_k_data('601318','1999-01-01','2018-1-28')

In [4]: df
Out[4]:
            date    open   close    high     low      volume    code
0     2007-03-01  21.254  19.890  21.666  19.469  1977633.51  601318
1     2007-03-02  19.979  19.728  20.166  19.503   425048.32  601318
2     2007-03-05  19.545  18.865  19.626  18.504   419196.74  601318
3     2007-03-06  18.704  19.235  19.554  18.597   297727.88  601318
4     2007-03-07  19.252  19.758  19.936  19.090   287463.78  601318
5     2007-03-08  19.596  19.520  19.694  19.418   130983.83  601318
...          ...     ...     ...     ...     ...         ...     ...
2754  2018-09-27  67.730  67.200  67.750  66.860   623574.00  601318
2755  2018-09-28  67.500  68.500  69.100  67.440   739523.00  601318

[2756 rows x 7 columns]
5、把获取的数据下载到本地
In [5]: df.to_csv('601318.csv')
一、DataFrame索引和切片
DataFrame有行索引和列索引
DataFrame同样可以通过标签和位置两种方法进行索引和切片
1、DataFrame使用索引切片

向DataFrame队形中写入值时只是用方法2
行/列索引部分可以是常规索引、切片、布尔值索引、花式索引任意搭配(注意:两部分都是花式索引时结果可能与预料的不同)
二、DataFrame通用标签获取
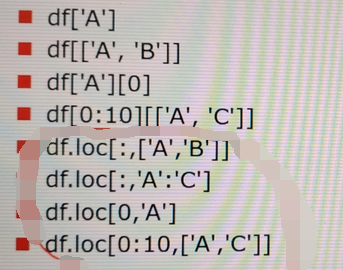
1、通过标签获取
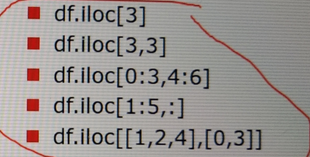
2、通过位置获取
3、通过布尔值获取

三、DataFrame查看数据
1、index 获取索引
df.index

2、T 置换
df3 = df2.T

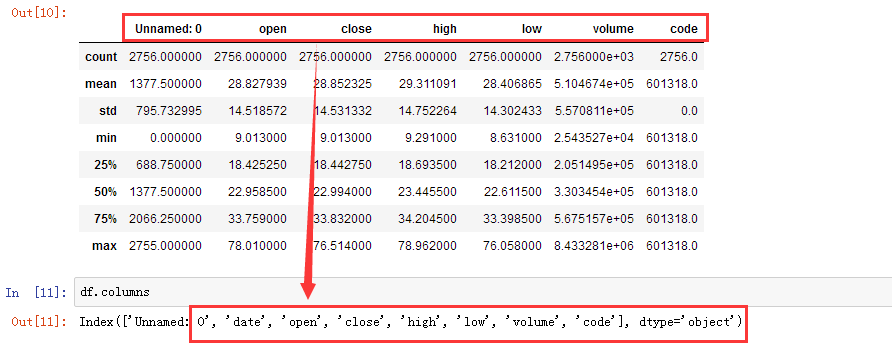
3、columns 获取列索引
df.columns
4、values 获取值数组
df.values

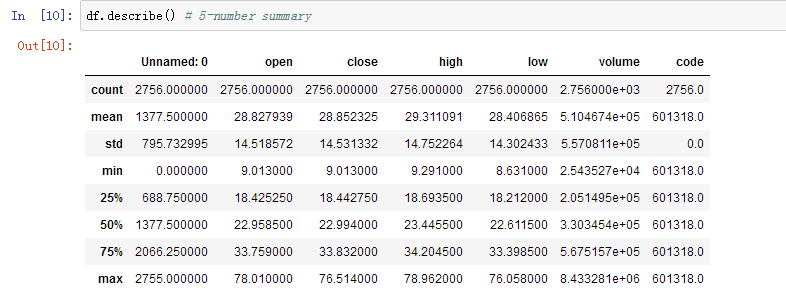
5、describe() 获取快速统计
df.describe()
6、重命名表头
1、用法

2、修改所有的列
df = pd.read_csv('601318.csv',header=None,names=list('asdfghjk'))

3、从头开始修改两列
df = pd.read_csv('601318.csv',header=None)
df = df.rename(columns={0:'a',1:'b'})

四、pandas其他常用方法
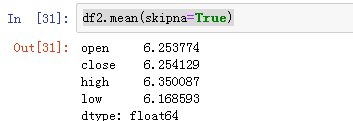
1、mean(axis=0,skipna=False)
df2.mean()
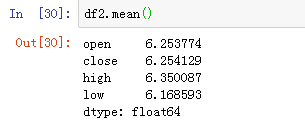
df2.mean(skipna=True)
2、sum(axis=1)
3、sort_index(axis,...,ascending)按行或列索引排序
df2.sort_index(ascending=False)

4、sort_values(by,axis,ascending) 按值排序
df2.sort_values('close')
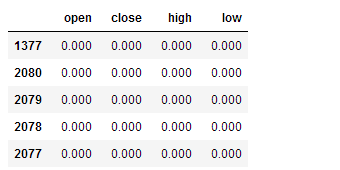
5、apply(func,axis=0)将自定义函数应用在各行或者各列上,func可返回标量或者Serise
df.apply(lambda x:x.mean(),axis=1)

df.apply(lambda x:x['high'] + x['low']/2,axis=1)
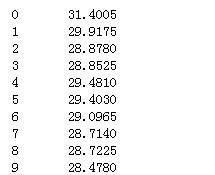
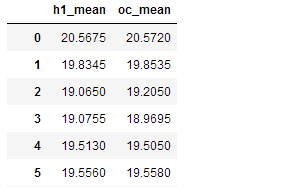
df.apply(lambda x:pd.Series([(x['high'] + x['low'])/2,(x['open'] +x['close'])/2],index=['h1_mean','oc_mean']),axis=1)
6、applymap(func) 将函数应用在DataFrame各个元素上
7、map(func)将函数应用在Series各个元素上
来源:https://www.cnblogs.com/luoahong/p/9799724.html