1.教程:
数学基础教材:
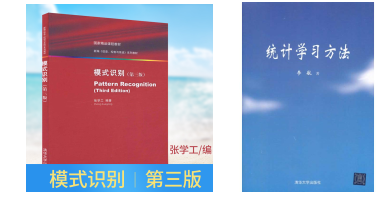
基础的微积分,线性代码,矩阵论,概率论等,所以这些教材就不推荐了,⼤家⾃⾏了解。倒是关于传统的机器学习,推荐两本书, ⼀本是模式识别,⼀本是统计学习。
数字图像处理:
冈萨雷斯的这本《数字图像处理》,是信号处理等专业的必修教材,是把图像处理基础理论与软件实践⽅法相结合的第⼀本书。

因为本书附带有 matlab 代码,⼤量来⾃于 MathWorks 公司的图像处理⼯具箱,可以边学边⽤。这本书基本上讲述了经典图像处理的主要内容,从亮度变换、线性和⾮线性空间滤波、图像增强与压缩、形态学图像处理、图像分割与边界等等,涵盖了领域内最基础的图像概念。
Opencv
欲学习图像处理, opencv 是绝对绕不开的,⼤部分⼯业界的代码⾥⾯⼀定有 opencv。opencv 经历过从以 c 语⾔为主的 1.0 版本,到以 c++为主的 2.0, 3.0 版本,4.0。直接从3开始。
.其他系统性的资料
3 图像基础概念与实践
3.1 图像位数
计算机是采⽤ 0/1 编码的系统,数字图像也是利⽤ 0/1 来记录信息,我们平常接触的图像都是 8 位数图像, 包含 0~255 灰度,其中 0,代表最⿊, 1,表⽰最⽩
3.2 彩色空间
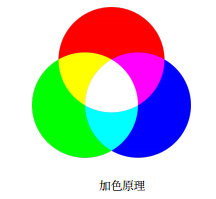
图像有灰度图有彩⾊图,灰度图即只包含亮度信息,⽽彩⾊图不仅包含亮度信息还包含颜⾊信息。灰度图不需要多说,彩⾊图平常我们接触的是 RGB 彩⾊图,即由红绿蓝 3 个通道组成,⼀张图像的每⼀个像素由⽮量(R, G, B)表⽰。这是在消费市场最⼴泛使⽤的,背后的⽣物学原理是⼈眼有对这 3 种颜⾊最敏感的细胞,被称为⽣物学原理,也被称为加⾊原理。
3.3 练习
2.使用 python+matplotlib,完成“柿子图” 的灰度直方图和彩色直方图统计。


3.完成 HSV, Lab 彩色空间的学习,使用 python+opencv 将上面的“柿子图”转换到相应空间。

4.使用灰度阈值,把大于阈值的像素分为前景,小于阈值的像素分为背景,查看各种阈值下分割结果,思考如何获取最好的结果
##--------经验阈值法--------##
##------Otsu阈值法------##

##------转换空间再求阈值------##


#coding:utf8
import cv2
import matplotlib.pyplot as plt
import numpy as np
import sys
import os

filename = '柿子.jpg' #柿子彩色图

##----- 彩色直方图------##

img = cv2.imread(filename)
colors = ['blue','green','red']
for i in range(3):
    hist, x = np.histogram(img[:,:,i].ravel(), bins = 256,range = (0,256))
    print(hist)
    print(x)
    print(x[:-1])
    print(x[1:])
    plt.plot(0.5*(x[:-1]+x[1:]), hist, label = colors[i], color = colors[i])

plt.show()

##------灰度直方图------##
img=cv2.imread(filename)
imgGrey = cv2.cvtColor(img,cv2.COLOR_BGR2GRAY)
colors=['grey']
print(imgGrey.shape)
for i in range(1):
    hist,x=np.histogram(imgGrey[:,:].ravel(),bins=256,range=(0,256))
    plt.plot(0.5*(x[:-1]+x[1:]),hist,label=colors[i],color=colors[i])
plt.show()

##-------BGR2HSV-------##
rgbimg = cv2.imread(filename)
rgbimg = cv2.resize(rgbimg,(600,400))

hsvimg = cv2.cvtColor(rgbimg,cv2.COLOR_BGR2HSV)
labimg = cv2.cvtColor(rgbimg,cv2.COLOR_BGR2Lab)

cv2.namedWindow("rgb",0)
cv2.namedWindow("lab",0)
cv2.namedWindow("hsv",0)

cv2.imshow("rgb",rgbimg)
cv2.imshow("lab",hsvimg)
cv2.imshow("hsv",labimg)

cv2.imwrite("柿子rgb.jpg",rgbimg)
cv2.imwrite("柿子Hsv.jpg",hsvimg)
cv2.imwrite("柿子lab.jpg",labimg)
cv2.waitKey(0)


img = cv2.imread(filename)
grey = cv2.cvtColor(img,cv2.COLOR_BGR2GRAY)
grey = cv2.resize(grey, (600,400))
##--------经验阈值法--------##
plt.figure(figsize=(12,6)) #表示figure的大小为宽、长(单位为inch)
plt.subplot(221)
plt.imshow(grey,cmap ='gray')
plt.title("original gray pic")

img50 = np.array(grey) # 把图片转换为array 然后再使用np的操作方式去操作
img50[img50<50] =0
plt.subplot(222)
plt.imshow(img50, cmap ="gray")
plt.title("threshold set to 50")


img100 = np.array(grey)
img100[img100<100] =0
plt.subplot(223)
plt.imshow(img100, cmap = "gray")
plt.title("threshold set to 100")

img150 = np.array(grey)
img150[img150<150] =0
plt.subplot(224)
plt.imshow(img150, cmap = "gray")
plt.title("threshold set to 150")

plt.tight_layout()
plt.show()


##------Otsu阈值法------##
greyblur = cv2.GaussianBlur(grey,(5,5),0)
th,result = cv2.threshold(greyblur,0,255,cv2.THRESH_BINARY+cv2.THRESH_OTSU)
print(th) #103.0
plt.figure(figsize=(12,6))

plt.subplot(221)
plt.imshow(grey,cmap ='gray')
plt.title("original gray pic")

plt.subplot(222)
plt.imshow(result, cmap="gray")
plt.title("otsu 2 threshold")

plt.subplot(223)
th,result = cv2.threshold(greyblur,0,255,cv2.THRESH_BINARY)
print(th) #0.0
plt.imshow(result, cmap="gray")
plt.title("otsu 1 threshold")

plt.subplot(224)
th,result = cv2.threshold(greyblur,0,255,cv2.THRESH_OTSU)
print(th) #103.0
plt.imshow(result, cmap="gray")
plt.title("otsu 1 threshold")
plt.show()


##------转换空间再求阈值------##
rgbimg=cv2.imread(filename)
rgbimg = cv2.resize(rgbimg,(600,400))
hsvimg = cv2.cvtColor(rgbimg,cv2.COLOR_BGR2HSV)

plt.figure(figsize=(12,6))
plt.subplot(131)
plt.imshow(hsvimg[:,:,0],cmap ='gray')
plt.title("h")
plt.subplot(132)
plt.imshow(hsvimg[:,:,1],cmap ='gray')
plt.title("s")
plt.subplot(133)
plt.imshow(hsvimg[:,:,2],cmap ='gray')
plt.title("v")
plt.show()

grey = hsvimg[:,:,2] #"v"
greyblur = cv2.GaussianBlur(grey,(5,5),0)
th,result = cv2.threshold(greyblur,0,255,cv2.THRESH_BINARY+cv2.THRESH_OTSU)
print(th) #156.0
plt.figure(figsize=(12,6))
plt.subplot(121)
plt.imshow(grey,cmap ='gray')
plt.title("original gray pic")
plt.subplot(122)
plt.imshow(result, cmap="gray")
plt.title("otsu threshold")
plt.show()
来源:CSDN
作者:快乐成长吧
链接:https://blog.csdn.net/qq_37791134/article/details/104109378