寒暄:终于放寒假了!昨天刚到家,论文先放一边,今天先复习一波MATLAB几个常用函数,更它一篇!
一、 disp() —— 显示文本或数组
1. 语法:
 disp(argument);
//说明:
//如果参量是数组,则显示数组的内容;
//如果参量是字符串,则显示字符串文本的内容。
2. 实例:
2.1 输出数字
>> num = 1;
>> disp(num);

输出:
1
2.2 输出字符串
>> disp(‘this is string’);

输出:
this is string
2.3 输出数字和字符串
>> num = 1;
>> disp([‘num:’,num2str(num)]);

输出:
num:1
2.4 输出数组
>> a=[1 2 3];
>> disp(a);

输出:
1 2 3
二、 figure() —— 创建/切换图窗窗口
1. 语法
//语法1:创建一个新的窗口,所有参数采用默认
figure;

//语法2:指定窗口ID,n为ID,且需为正整数,否则报错
figure(n);

//语法3:可以指定窗口的某些属性
//PropertyName:所选属性名,可选的有toolbar、NumberTitle、position、name、menubar;
//propertyvalue:对应的属性值。
figure('PropertyName',propertyvalue,...);

//语法4:返回窗口的句柄,且n为窗口ID
h = figure(n);
备注:(语法3常用的几类属性如下)
(1)窗口外观
| 属性名 | 属性值 | 说明 |
|---|---|---|
| MenuBar | ‘figure’ (默认)或 ‘none’ | 菜单栏显示方式 |
| ToolBar | ‘auto’ (默认)或 ‘figure’ | 工具栏显示 |
| DockControls | ‘on’ (默认)或 ‘off’ | 交互式停靠 |
| Color | RGB 三元组、十六进制颜色代码、颜色名称或短名称 | 背景色 |
| WindowStyle | ‘normal’ (默认)或 ‘modal’ 或 ‘docked’ | 窗口样式 |
| WindowState | ‘normal’ (默认)或 ‘minimized’ 或 ‘maximized’ 或 ‘fullscreen’ | 窗口状态 |
(2)位置
| 属性名 | 属性值 | 说明 |
|---|---|---|
| Position | 四元组,如: [left bottom width height] | 可绘制区域的位置和大小 |
| Units | ‘pixels’ (默认) 或 ‘normalized’ 或 ‘inches’ 或 ‘centimeters’ 或 ‘points’ 或 ‘characters’ | 测量单位 |
| InnerPosition | 四元组,如:[left bottom width height] | 可会知区域的位置和大小 |
| OuterPosition | 四元组,如:[left bottom width height] | 外部边界的位置和大小 |
| Resize | ‘on’ (默认)或 | ‘off’ |
(3)绘图
| 属性名 | 属性值 | 说明 |
|---|---|---|
| Colormap | parula (默认)或 由 RGB 三元组组成的 m×3 数组 | 图窗坐标区内容的颜色图 |
| Alphamap | 由从 0 到 1 的 64 个值组成的数组 (默认) 或 由从 0 到 1 的有限 alpha 值组成的数组 | Axes 内容的透明度映射 |
| NextPlot | ‘add’ (默认)或 ‘new’ 或 ‘replace’ 或 ‘replacechildren’ | 有关如何添加下一绘图的指令 |
| Renderer | ‘opengl’ (默认)或 ‘painters’ | 渲染器 |
| RendererMode | ‘auto’ (默认)或 ‘manual’ | 渲染器选择 |
| GraphicsSmoothing | ‘on’ (默认)或 ‘off’ | 坐标区图形平滑处理 |
*Figure详细属性可在官网文档查看,下方给出超链接。
2. 实例
2.1 默认创建新窗口
>> figure;
2.2 指定窗口ID
>> figure(2);
2.3 指定窗口某些属性
//指定窗口的标题
>> figure('name','窗口1');
//其中属性值为一个四元数组 rect = [left, bottom, width, height];
//第一、二个参数表示窗口位置,都是从屏幕的左下角计算的。
>> figure('position',[600, 300, 300, 200]);
//指定窗口的标题和窗口的背景颜色
>> figure('Name','窗口1','color','b');
//将f1窗口的背景色属性设置为蓝色
>> f1 = figure(1);
>> set(f1,'Color','r');
//关闭默认显示窗口标题
>> figure('NumberTitle','off');
//不显示工具栏、菜单栏
>> figure('toolbar','none','menubar','none');
三、 plot() —— 绘制二维图像
1. 语法
plot(Y);
//如果Y是m×n的数组,以1:m为X横坐标,Y中的每一列元素为Y坐标,绘制n条曲线;
//如果Y是n×1或者1×n的向量,则以1:n为横坐标,Y为坐标表绘制1条曲线;
//如果Y是复数,则plot(Y)等效于plot(real(Y),imag(Y));
//其它使用情况下,忽略坐标数据中的虚部。
plot(X,Y,...)
//如果X和Y都是数组,按列取坐标数据绘图,此时它们必须具有相同的尺寸;
//如果X和Y其中一个是向量另一个为数组,X和Y中尺寸相等的方向对应绘制多条曲线;
//如果X和Y其中一个是标量另一个为向量,那么将绘制垂直X或者Y轴离散的点。
plot(x,y,LineSpec,...);
//通过参数LineSpec指定曲线的曲线属性,它包括线型、标记符和颜色
plot(x,y,'PropertyName',ProperValue,...);
//设置由plot创建的所有曲线句柄对象的属性,Line对象属性和属性值参见附录;
//具体设置参考下面的实例,当然可以使用set/get进行设置
备注:(可选的属性如下)
| 线型 | 说明 | 标记符 | 说明 | 颜色 | 说明 |
|---|---|---|---|---|---|
| - | 实线(默认) | + | 加号 | r | 红色 |
| – | 双划线 | o | 空心圆 | g | 绿色 |
| : | 虚线 | * | 星号 | b | 蓝色 |
| :. | 点划线 | . | 实心圆 | c | 青绿色 |
| x | 叉号符 | m | 洋红色 | ||
| s | 正方形 | y | 黄色 | ||
| d | 菱形 | k | 黑色 | ||
| ^ | 上三角形 | w | 白色 | ||
| v | 下三角形 | ||||
| > | 右三角形 | ||||
| < | 左三角形 | ||||
| p | 五角星 | ||||
| h | 六边形 |
下面四个属性设置标识符的颜色和大小:(四个属性是针对当前坐标系中所有曲线的)
(1)LineWidth : 指定线宽
(2)MarkerEdgeColor : 指定标识符的边缘颜色
(3)MarkerFaceColor : 指定标识符填充颜色
(4)MarkerSize : 指定标识符的大小
设置曲线线型、标识符和颜色三项属性时,控制符的顺序不受限制并可以省略或者部分省略。
2. 实例
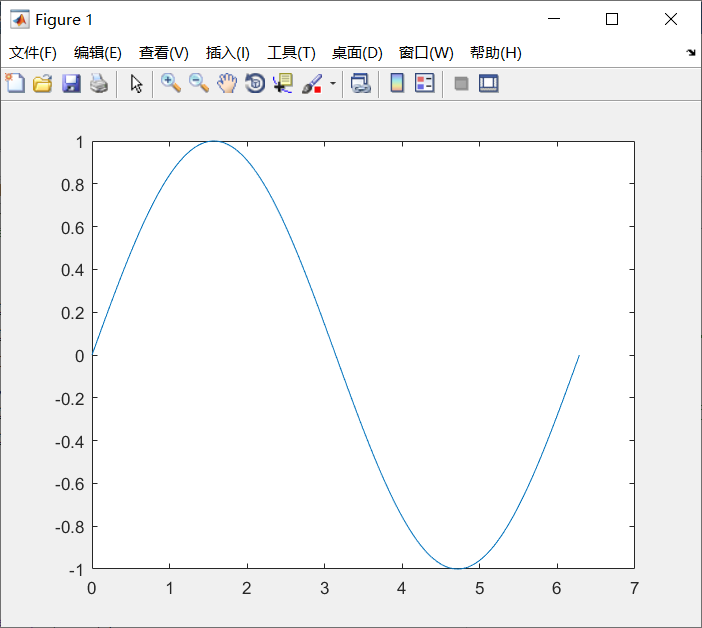
2.1 创建线图
>> x = 0:pi/100:2*pi;
>> y = sin(x);
>> plot(x,y)
执行结果:
2.2 创建多个线条
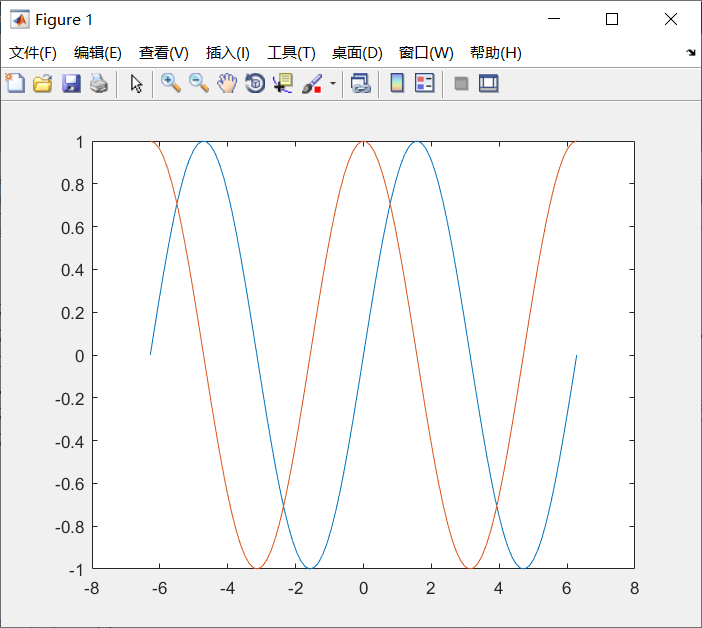
>> x = linspace(-2*pi,2*pi);
>> y1 = sin(x);
>> y2 = cos(x);

>> figure
>> plot(x,y1,x,y2)
执行结果:
2.3 根据矩阵创建线图
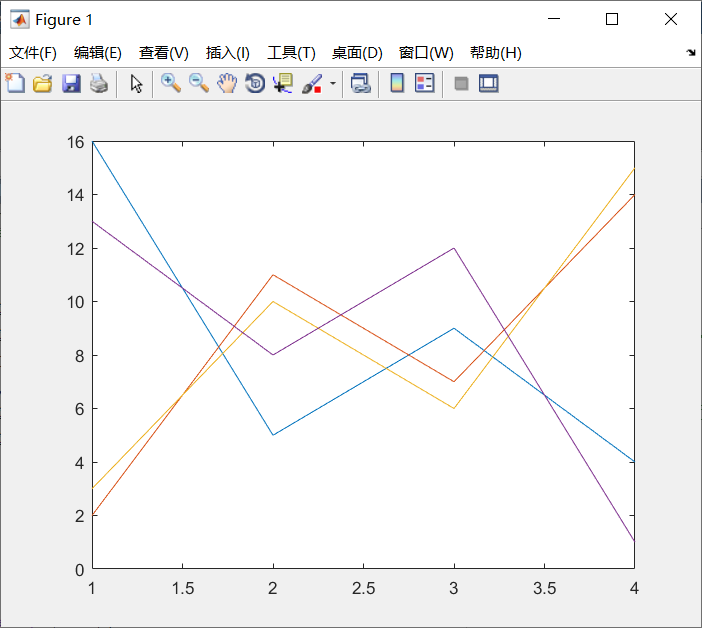
>> Y = magic(4);
>> figure;
>> plot(Y);
执行结果:
2.4 指定线型
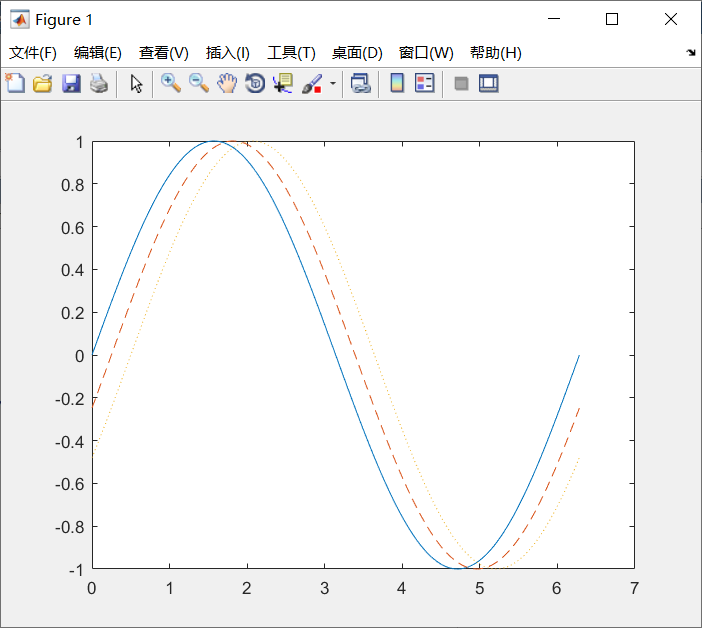
>> x = 0:pi/100:2*pi;
>> y1 = sin(x);
>> y2 = sin(x-0.25);
>> y3 = sin(x-0.5);

>> figure;
>> plot(x,y1,x,y2,'--',x,y3,':');
执行结果:
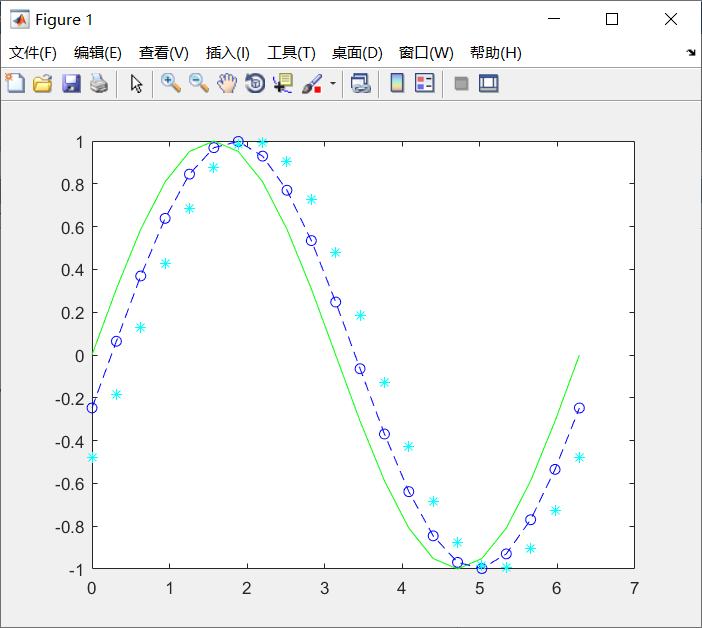
2.5 指定线型、颜色和标记
>> x = 0:pi/10:2*pi;
>> y1 = sin(x);
>> y2 = sin(x-0.25);
>> y3 = sin(x-0.5);

>> figure;
>> plot(x,y1,'g',x,y2,'b--o',x,y3,'c*');
执行结果:
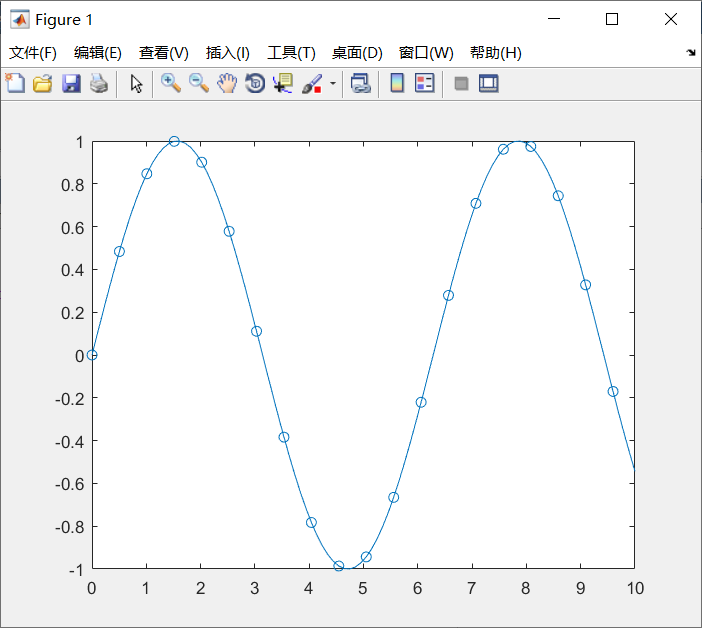
2.6 在特定的数据点显示标记
>> x = linspace(0,10);
>> y = sin(x);
>> plot(x,y,'-o','MarkerIndices',1:5:length(y));
执行结果:
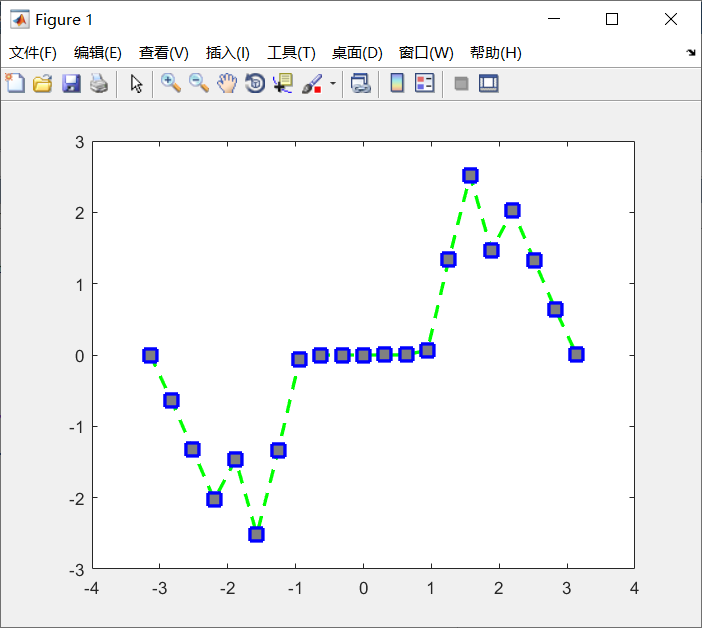
2.7 指定线宽、标记大小和标记颜色
>> x = -pi:pi/10:pi;
>> y = tan(sin(x)) - sin(tan(x));

>> figure
>> plot(x,y,'--gs',...
    'LineWidth',2,...
    'MarkerSize',10,...
    'MarkerEdgeColor','b',...
    'MarkerFaceColor',[0.5,0.5,0.5])
执行结果:
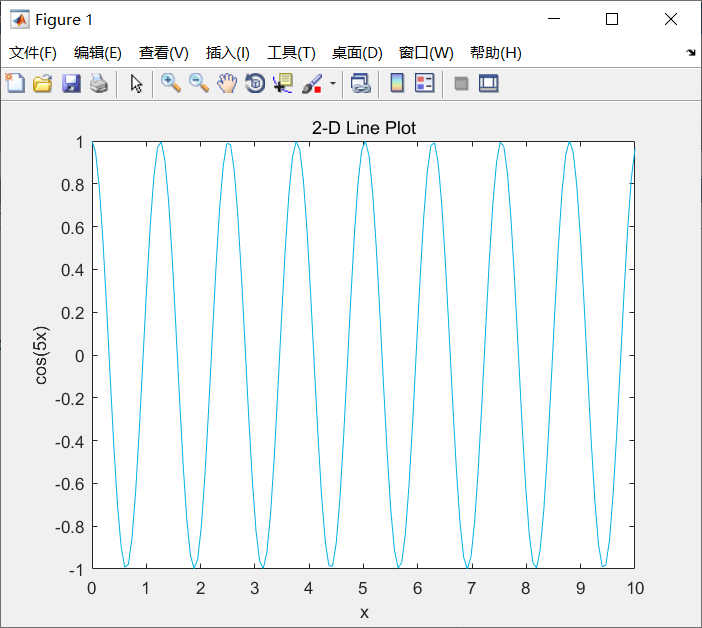
2.8 添加标题和轴标签
>> x = linspace(0,10,150);
>> y = cos(5*x);

>> figure
>> plot(x,y,'Color',[0,0.7,0.9])

>> title('2-D Line Plot')
>> xlabel('x')
>> ylabel('cos(5x)')
执行结果:
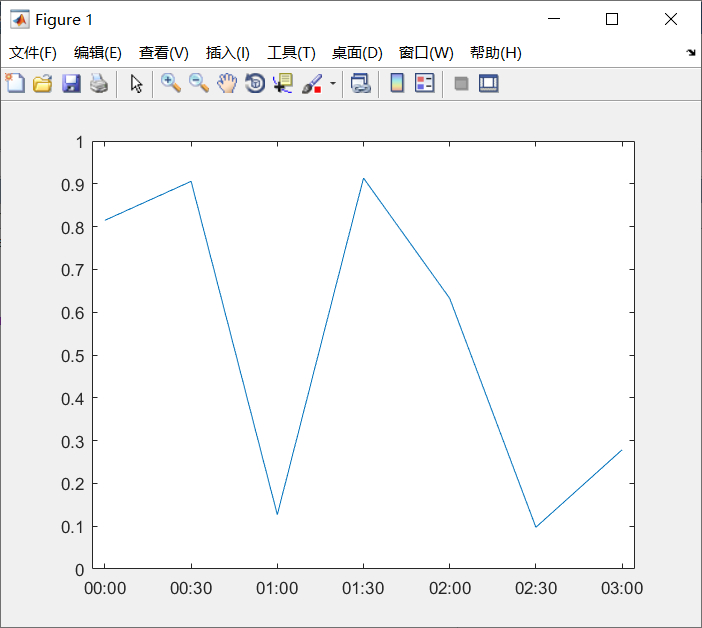
2.9 绘制持续时间并指定刻度格式
>> t = 0:seconds(30):minutes(3);
>> y = rand(1,7);

>> plot(t,y,'DurationTickFormat','mm:ss')
执行结果:
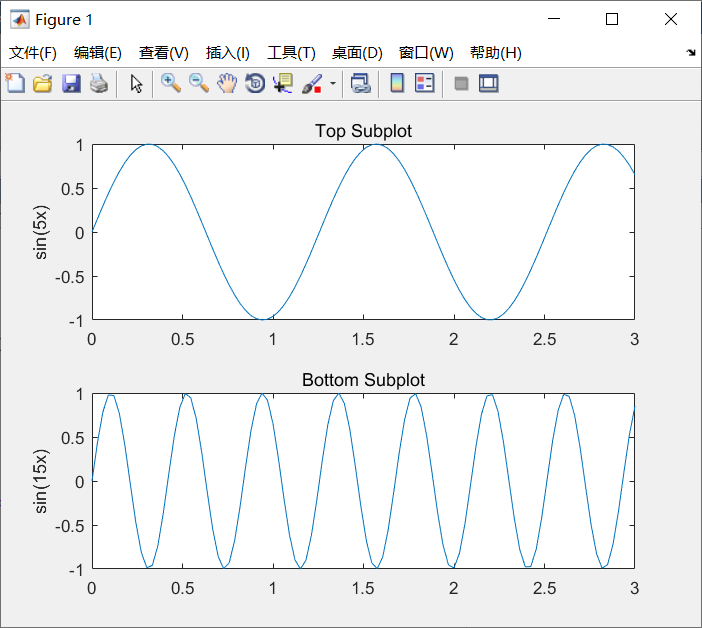
2.10 指定线图的坐标区
>> ax1 = subplot(2,1,1); % top subplot
>> x = linspace(0,3);
>> y1 = sin(5*x);
>> plot(ax1,x,y1)
>> title(ax1,'Top Subplot')
>> ylabel(ax1,'sin(5x)')

>> ax2 = subplot(2,1,2); % bottom subplot
>> y2 = sin(15*x);
>> plot(ax2,x,y2)
>>title(ax2,'Bottom Subplot')
>>ylabel(ax2,'sin(15x)')
执行结果:
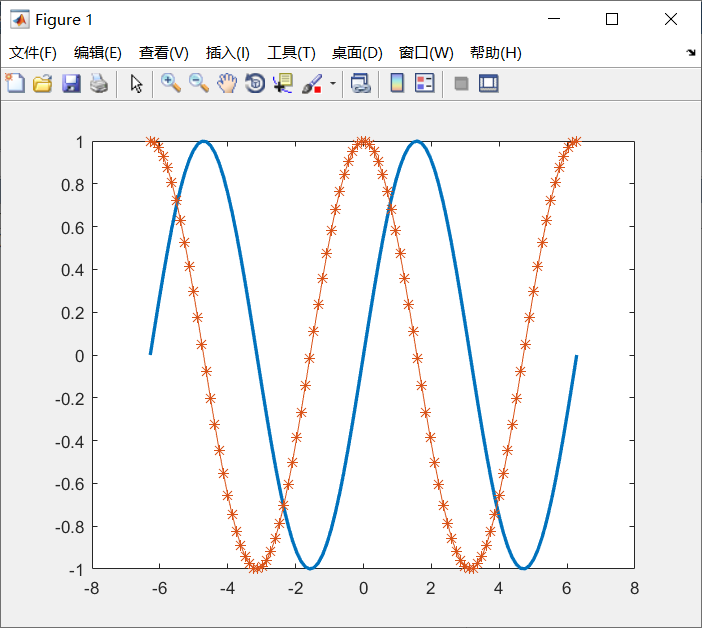
2.11 创建并修改线条
>> x = linspace(-2*pi,2*pi);
>> y1 = sin(x);
>> y2 = cos(x);
>> p = plot(x,y1,x,y2);

>> p(1).LineWidth = 2;
>> p(2).Marker = '*';
执行结果:
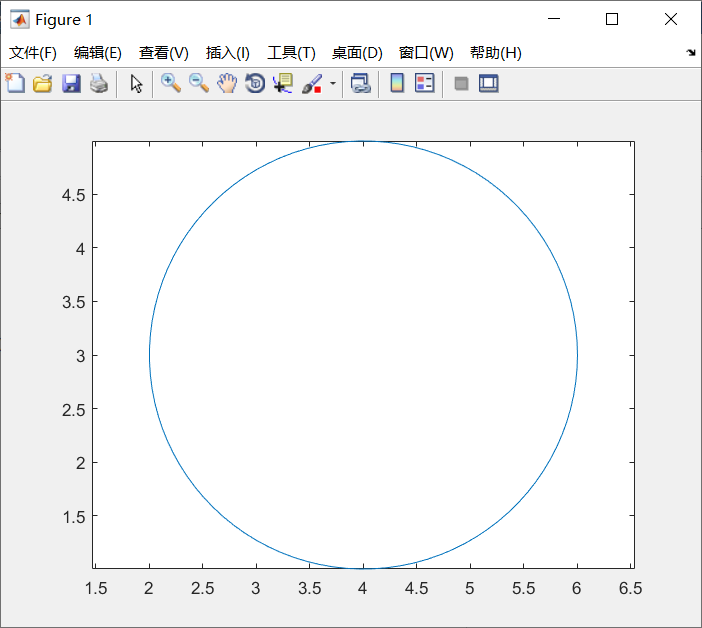
2.12 绘制圆形
>> r = 2;
>> xc = 4;
>> yc = 3;

>> theta = linspace(0,2*pi);
>> x = r*cos(theta) + xc;
>> y = r*sin(theta) + yc;
>> plot(x,y)
>> axis equal
执行结果:
四、 text() —— 向数据点添加文本说明
1. 语法
text(x,y,txt)
//x,y是位置,txt是说明文字;
//如果说明文字是数字,则这样写:text(x,y,num2str(1));
//设置说明文字颜色,这样写:text(x,y,txt,'color','k')
2.实例
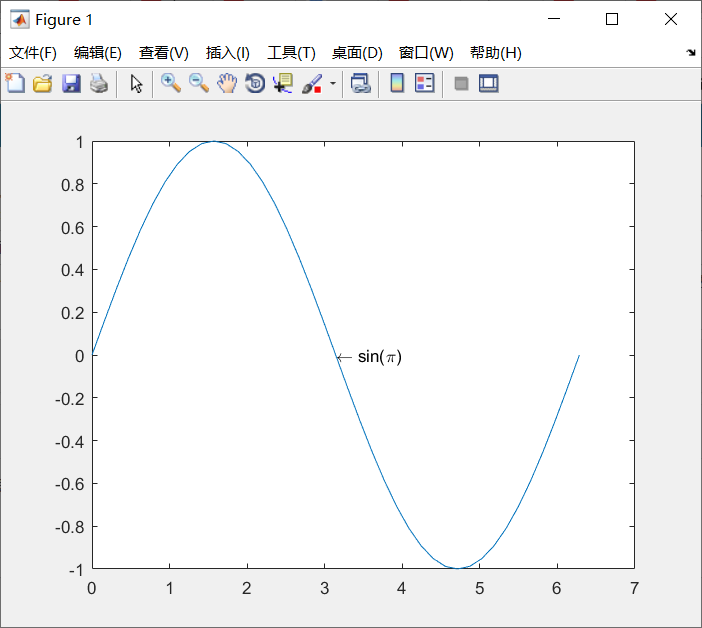
2.1 向数据点添加文本说明
>> x = 0:pi/20:2*pi;
>> y = sin(x);
>> plot(x,y)
>> text(pi,0,'\leftarrow sin(\pi)')
执行结果:
2.2 向多个数据点添加文本
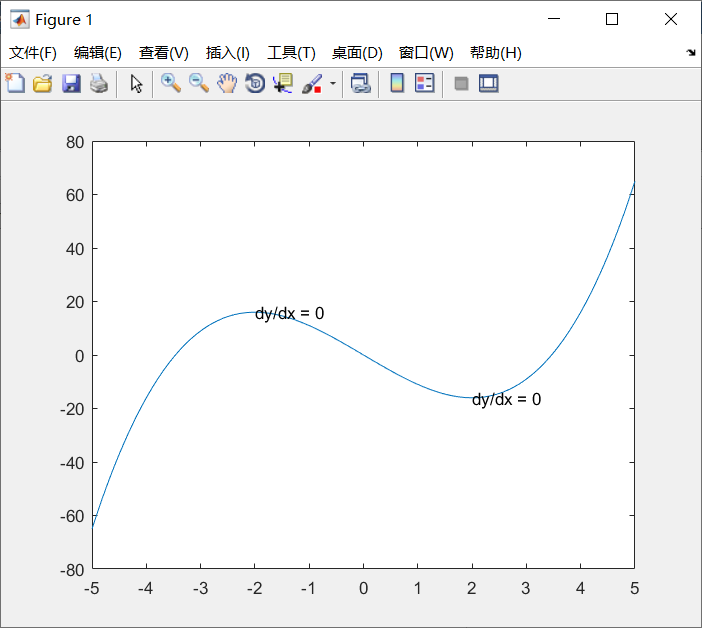
方式一:
>> x = linspace(-5,5);
>> y = x.^3-12*x;
>> plot(x,y)

>> xt = [-2 2];
>> yt = [16 -16];
>> str = 'dy/dx = 0';
>> text(xt,yt,str)
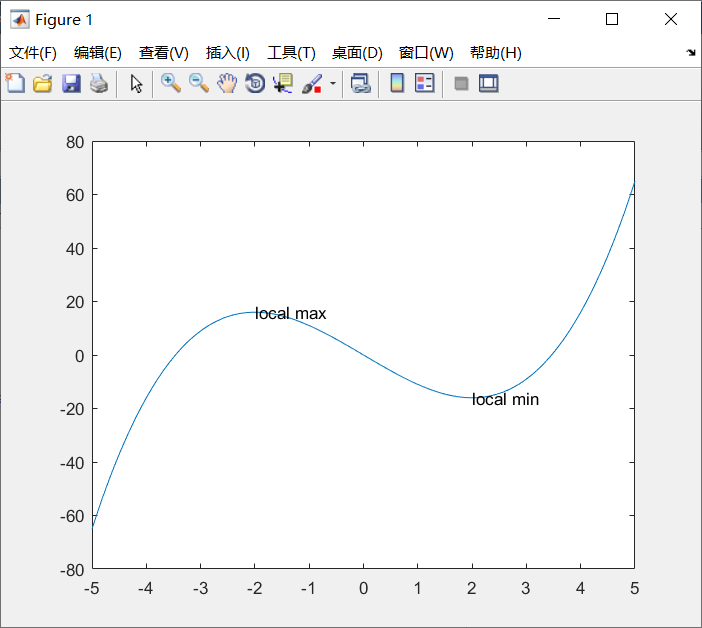
方式二:
>> x = linspace(-5,5);
>> y = x.^3-12*x;
>> plot(x,y)

>> xt = [-2 2];
>> yt = [16 -16];
>> str = {'local max','local min'};
>> text(xt,yt,str)
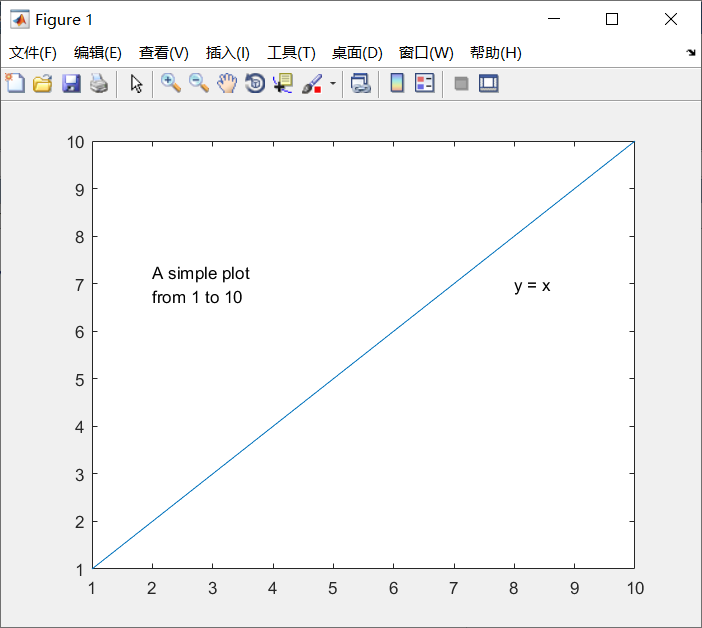
2.3 显示多行文本
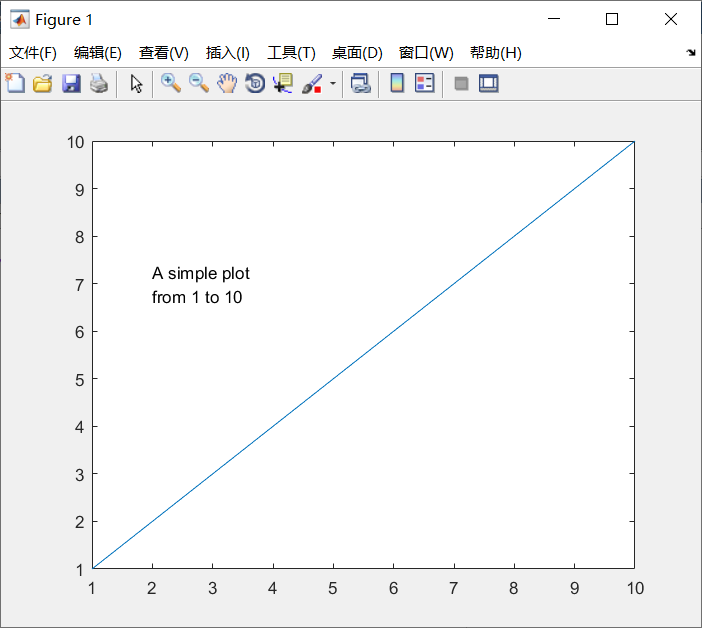
方式一:
>> plot(1:10)
>> str = {'A simple plot','from 1 to 10'};
>> text(2,7,str)
方式二:
>> plot(1:10)
>> str = {{'A simple plot','from 1 to 10'},'y = x'};
>> text([2 8],[7 7],str)
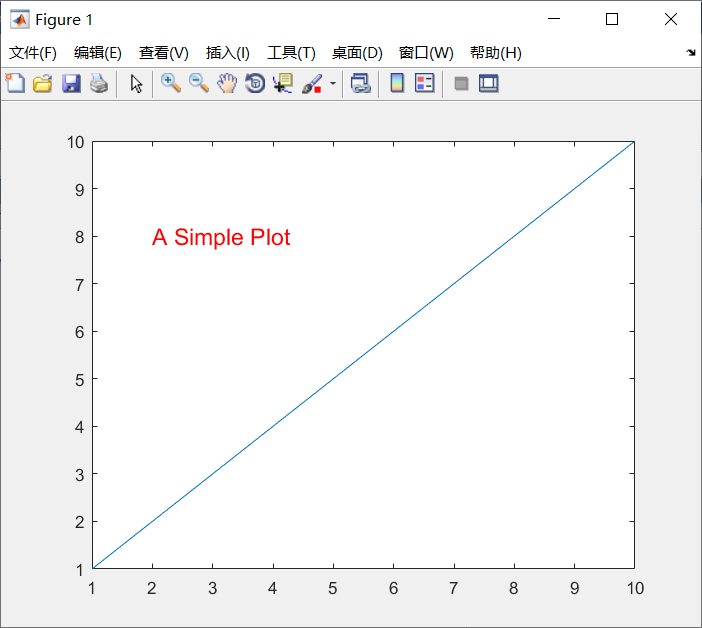
2.4 指定文本大小和颜色
>> plot(1:10)
>> text(2,8,'A Simple Plot','Color','red','FontSize',14)
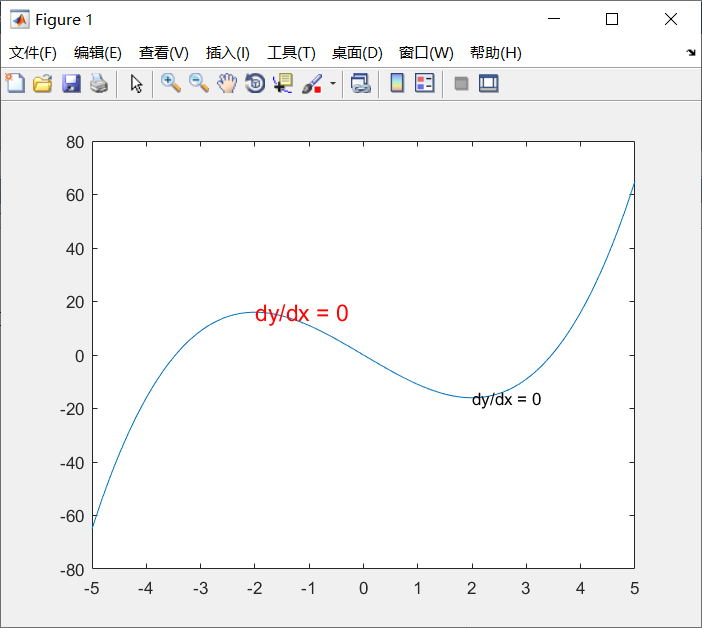
2.5 修改现有文本
>> x = linspace(-5,5);
>> y = x.^3-12*x;
>> plot(x,y)
>> t = text([-2 2],[16 -16],'dy/dx = 0')

>> t(1).Color = 'red';
>> t(1).FontSize = 14;
五、line() —— 绘制线条
1. 语法
line(X,Y)
//X为横坐标向量,[起点横坐标,终点横坐标];
//Y为纵坐标向量,[起点纵坐标,终点纵坐标]。
line(X,Y,'PropertyName',PropertyValue,...)
2. 实例
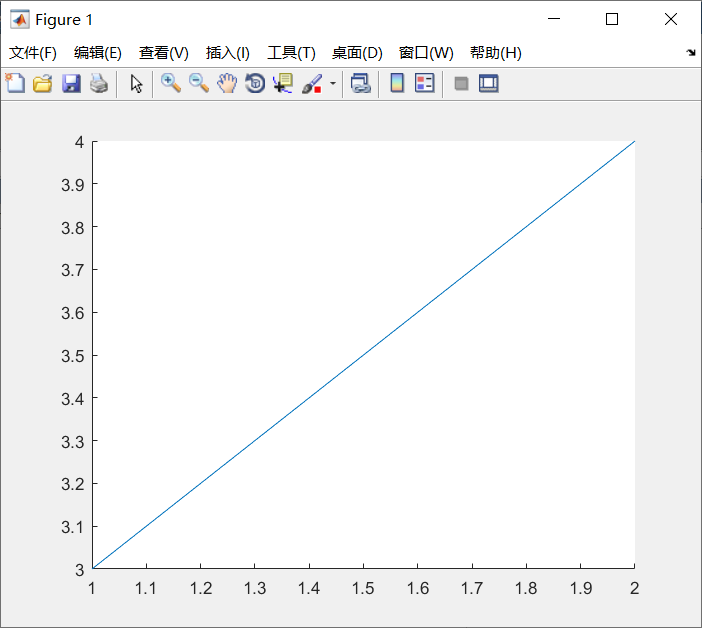
2.1 使用向量数据绘制线条
>> line([1,2],[3,4]);
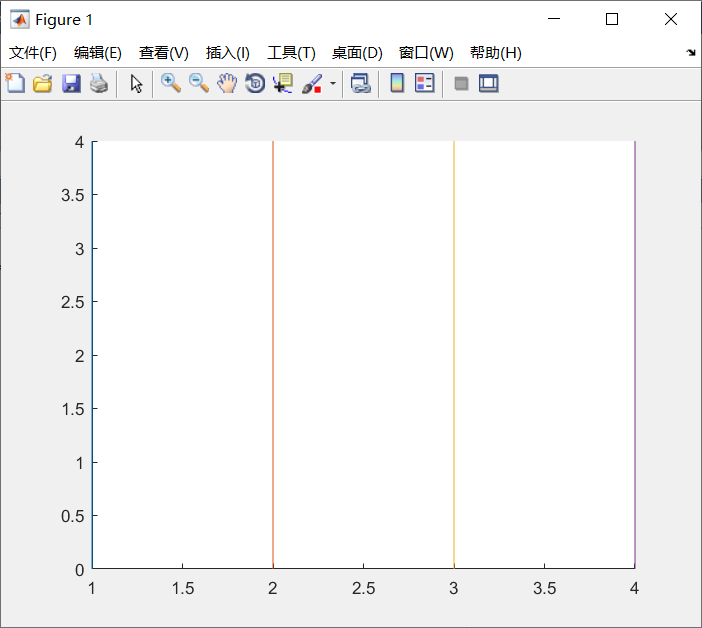
2.2 使用矩阵数据绘制多个线条
>> a=[1:4;1:4];
>> b=[zeros(1,4);ones(1,4)*4];
>> line(a,b);
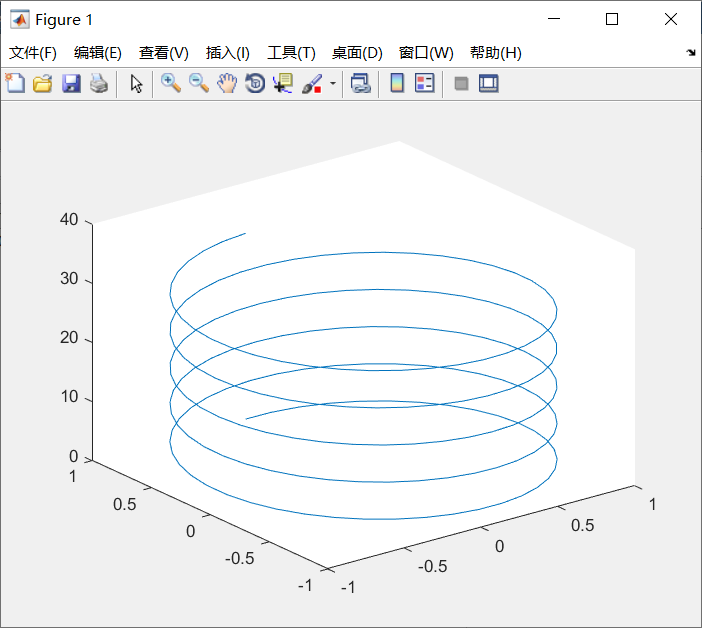
2.3 使用三维坐标绘制线条
>> t = linspace(0,10*pi,200);
>> x = sin(t);
>> y = cos(t);
>> z = t;
>> line(x,y,z)
>> view(3)
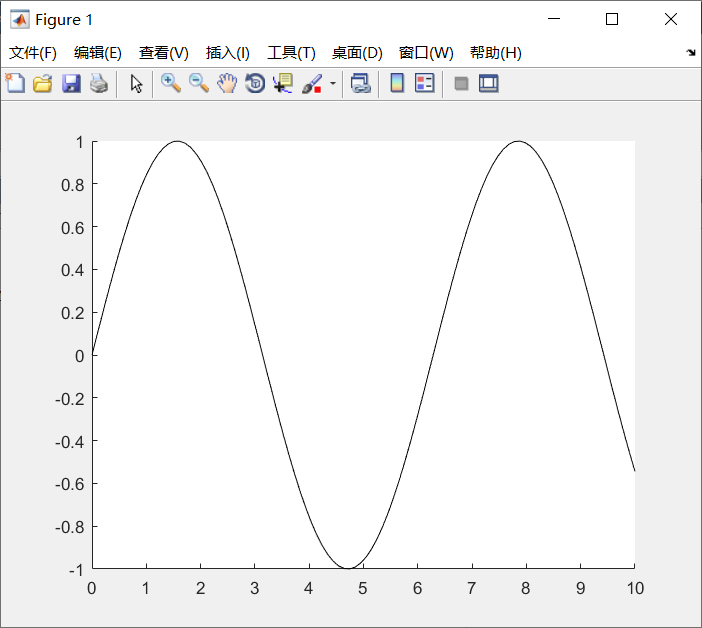
2.4 使用低级别语法绘制线条
>> x = linspace(0,10);
>> y = sin(x);
>> line('XData',x,'YData',y)
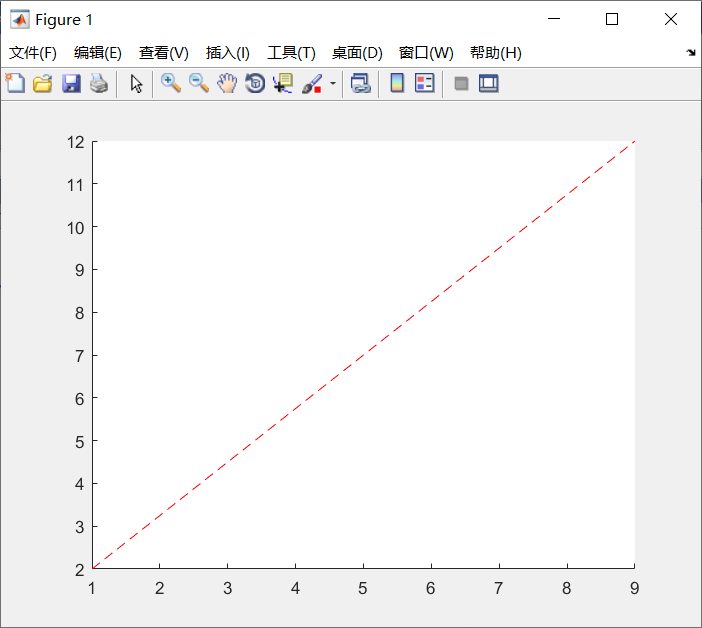
2.5 指定线条属性
>> x = [1 9];
>> y = [2 12];
>> line(x,y,'Color','red','LineStyle','--')
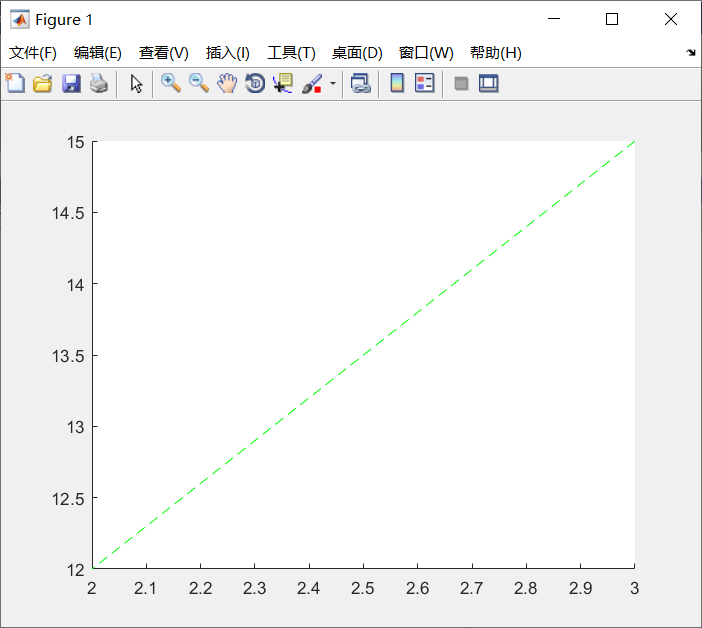
2.6 创建后更改线条属性
>> x = [3 2];
>> y = [15 12];
>> pl = line(x,y);

>> pl.Color = 'green';
>> pl.LineStyle = '--';
来源:CSDN
作者:视觉闫小亘
链接:https://blog.csdn.net/two_ye/article/details/104049676