问题
With a Perl script I generate numerous Google Line Charts for 20 and more series of data at once.
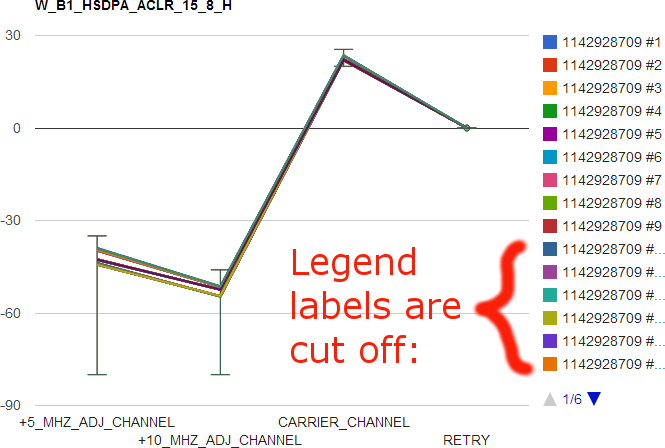
The legend labels are of the form: a serial number appended by an iterating #counter.
Unfortunately, starting with #10 those counters are cut off:

Is there maybe a way to stop Google charts from doing that?
My quite simple chart code is below:
    var data = { ...... };

    function drawCharts() {
            for (var csv in data) {
                    var x = new google.visualization.DataTable(data[csv]);

                    var options = {
                            title: csv,
                            width: 800,
                            height: 600
                    };

                    var chart = new google.visualization.LineChart(document.getElementById(csv));
                    chart.draw(x, options);
            }
    }

    $(function() {
            google.setOnLoadCallback(drawCharts);
    });
回答1:
To get full legend in your chart just add chartArea width and height as below
var options = {
              title: csv,
              width: 800,
              height: 600,
              chartArea: {  width: "50%", height: "70%" }
};
Take a look at this jqfaq.com to get a working sample
回答2:
in chartArea, make width 30 percent move the graph to the center.
chartArea: { width: "30%", height: "50%" }
来源:https://stackoverflow.com/questions/16980002/how-to-prevent-legend-labels-being-cut-off-in-google-charts