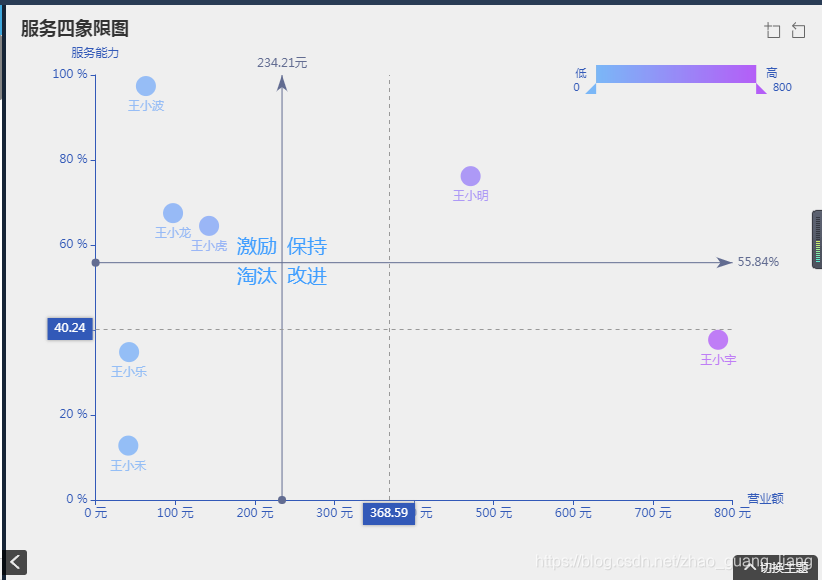
echarts四象限图加图例

北战南征 提交于 2019-12-27 11:42:30

基于社区内图表的改动,以下是原图:

在这里插入图片描述

下边是改动后,添加了图例,区域缩放功能可以根据个人需求修改。

在这里插入图片描述

代码如下:

var xiaoLv2_color = ['#CC9999','#8BBA00','#FF8E46','#90CECE','#DB5D5D','#AFD8F8','#FDC689','#6DCFF6','#C0B73F','#CC99FF']
    var xiaoLv2_name = ['a','b','c','d','f']
    var xiaoLv2_value = [[0.2,0.3],[1.2,0.5],[1.4,0.5],[1.5,1.5]]
    var o_data = [{
        type: 'scatter',
        markLine: {
            label: {
                normal: {
                }
            },
            lineStyle: {
                normal: {
                    color: "#666",
                    type: 'solid',
                    width: 0.5,
                },
            },
            data: [{
                label:{
                    show:false
                },
                xAxis:1,
                name: '费用消耗指数平均线',
                itemStyle: {
                    normal: {
                        color: "#000",
                    }
                }
            }, {
                label:{
                    show:false
                },
                yAxis: 1,
                name: '时间消耗指数平均线',
                itemStyle: {
                    normal: {
                        color: "#b84a58",
                    }
                }
            }]
        },
        markArea: {
            silent: true,
            data: [
                [{
                    name: 'Ⅳ',
                    itemStyle: {
                        normal: {
                            color: '#fff'
                        },
                    },
                    label: {
                        normal: {
                            show: true,
                            position: 'insideBottomRight',
                            fontStyle: 'normal',
                            backgroundColor:'#ccc',
                            color: "#000",
                            fontSize: 20,
                        }
                    },
                    coord: [1,0],
                }, {
                    coord: [2, 0],
                }],
                [{
                    name: 'Ⅲ',
                    itemStyle: {
                        normal: {
                            color: 'transparent',
                        },
                    },
                    label: {
                        normal: {
                            show: true,
                            position: 'insideBottomLeft',
                            fontStyle: 'normal',
                            backgroundColor:'#ccc',
                            color: "#000",
                            fontSize: 20,
                        }
                    },
                    coord: [0, 0],
                }, {
                    coord: [1,0],
                }],
                [{
                    name: 'Ⅰ',
                    itemStyle: {
                        normal: {
                            color: 'transparent',

                        },
                    },
                    label: {
                        normal: {
                            show: true,
                            position: 'insideTopRight',
                            backgroundColor:'#ccc',
                            fontStyle: 'normal',
                            color: "#000",
                            fontSize: 20,
                        }
                    },
                    coord: [1,1],
                }, {
                    coord: [2,1],
                }],
                [{
                    name: 'Ⅱ',
                    itemStyle: {
                        normal: {
                            color: 'transparent',
                        },
                    },
                    label: {
                        normal: {
                            show: true,
                            position: 'insideTopLeft',
                            fontStyle: 'normal',
                            backgroundColor:'#ccc',
                            color: "#000",
                            fontSize: 20,
                        }
                    },
                    coord: [0,1],
                }, {
                    coord: [1,1],
                }],
            ]
        }
    }]
    for(var i=0;i<xiaoLv2_name.length;i++){
        o_data.push({
            type: 'scatter',
            name: xiaoLv2_name[i],
            data: [xiaoLv2_value[i]],
            symbolSize: 10,
            color: xiaoLv2_color[i]
        })
    }
    xiaoLv2_option = {
        legend: {
            data: xiaoLv2_name
        },
        title:{
            text:'时\n间\n消\n耗\n指\n数',
            textStyle:{
                fontSize:10
            },
            top:90,
            left:-5
        },
        tooltip: {
            trigger: 'item',
            axisPointer: {
                show: true,
                type: 'cross',
                lineStyle: {
                    type: 'dashed',
                    width: 1
                },
            },
            formatter: function(obj) {
                if (obj.seriesType == "scatter") {
                    return '<div style="border-bottom: 1px solid rgba(255,255,255,.3); font-size: 18px;padding-bottom: 7px;margin-bottom: 7px">' +
                        obj.seriesName+
                        '</div>' +
                        '<span>' +
                        '费用消耗指数' +
                        '</span>' +
                        ' : ' + obj.data[0] +
                        '<br/>' +
                        '<span>' +
                        '时间消耗指数' +
                        '</span>' +
                        ' : ' + obj.data[1]
                }
                return ''
            }
        },
        grid:{
            top:'20%',
            right:'10%',
            left: '10%',
            show: true,
            borderColor: '#666',
            backgroundColor: '#ffffff'
        },
        xAxis: {
            name: '费用消耗指数',
            type: 'value',
            scale: true,
            max: '1.9',
            min: '0',
            splitLine: {
                show: false
            },
            axisLine: {
                lineStyle: {
                    color: '#666'
                }
            },
            axisTick:{
                inside:true,
            },
            nameTextStyle:{
                verticalAlign:'bottom',
                padding:[60,0,0,-190],
                fontSize: 10
            }
        },
        yAxis: {
            name: '',
            type: 'value',
            scale: true,
            max: '1.8',
            min: '0',
            axisTick:{
                inside:true,
            },
            splitLine: {
                show: false
            },
            axisLine: {
                lineStyle: {
                    color: '#666'
                }
            }
        },
        series: o_data
    };


标签
易学教程内所有资源均来自网络或用户发布的内容,如有违反法律规定的内容欢迎反馈
该文章没有解决你所遇到的问题?点击提问,说说你的问题,让更多的人一起探讨吧!