1.数据集简介
此数据集一共有891条数据,数据内容如下,每列表示的意义如下:
| 乘客ID | 是否幸存 | 舱位等级 | 姓名 | 性别 | 年龄 | 一同上船的兄弟姐妹 | 父母和小孩数目 | 船号 | 船价 | 船仓号 | 登录地点 |
| PassengerId | Survived | Pclass | Name | Sex | Age | SibSp | Parch | Ticket | Fare | Cabin | Embarked |
| 1 | 0 | 3 | Braund, Mr. Owen Harris | male | 22 | 1 | 0 | A/5 21171 | 7.25 | S | |
| 2 | 1 | 1 | Cumings, Mrs. John Bradley (Florence Briggs Thayer) | female | 38 | 1 | 0 | PC 17599 | 71.2833 | C85 | C |
| 3 | 1 | 3 | Heikkinen, Miss. Laina | female | 26 | 0 | 0 | STON/O2. 3101282 | 7.925 | S | |
| 4 | 1 | 1 | Futrelle, Mrs. Jacques Heath (Lily May Peel) | female | 35 | 1 | 0 | 113803 | 53.1 | C123 | S |
| 5 | 0 | 3 | Allen, Mr. William Henry | male | 35 | 0 | 0 | 373450 | 8.05 | S |
2.缺失值处理:
查看数据后,发现在Age列,有部分值缺失,将缺失值用中位数进行填充
titanic = pandas.read_csv("titanic_train.csv")
print(titanic.head(5))  # 显示前5条信息
# pandas.set_option('display.max_columns', None)  # 显示所有列
# pandas.set_option('display.max_rows', None)  # 显示所有行

# 对Age列进行缺失值titanic["Age"].fillna 填充此列中位数titanic["Age"].median()
titanic["Age"] = titanic["Age"].fillna(titanic["Age"].median())
print(titanic.describe())  # 显示统计信息
填充完之后,初步显示模型的统计信息,主要包括数量、均值、标准差、最小值、4分位数、最大值。
      PassengerId    Survived      Pclass         Age       SibSp  \
count   891.000000  891.000000  891.000000  891.000000  891.000000
mean    446.000000    0.383838    2.308642   29.361582    0.523008
std     257.353842    0.486592    0.836071   13.019697    1.102743
min       1.000000    0.000000    1.000000    0.420000    0.000000
25%     223.500000    0.000000    2.000000   22.000000    0.000000
50%     446.000000    0.000000    3.000000   28.000000    0.000000
75%     668.500000    1.000000    3.000000   35.000000    1.000000
max     891.000000    1.000000    3.000000   80.000000    8.000000

            Parch        Fare
count  891.000000  891.000000
mean     0.381594   32.204208
std      0.806057   49.693429
min      0.000000    0.000000
25%      0.000000    7.910400
50%      0.000000   14.454200
75%      0.000000   31.000000
max      6.000000  512.329200
3.字符串数据转化为数值型变量,将男性用0表示,女性用1表示;登录地点S、C、Q分别用0,1,2表示。
print(titanic["Sex"].unique())  # Sex列的属性值有哪些值
titanic.loc[titanic["Sex"] == "male", "Sex"] = 0  # 将字符串映射为数字
titanic.loc[titanic["Sex"] == "female", "Sex"] = 1

# print(titanic["Embarked"].unique())
titanic["Embarked"] = titanic["Embarked"].fillna('S')  # fillna()缺失值填充,用S
titanic.loc[titanic["Embarked"] == "S", "Embarked"] = 0  # 数值映射
titanic.loc[titanic["Embarked"] == "C", "Embarked"] = 1
titanic.loc[titanic["Embarked"] == "Q", "Embarked"] = 2
4. 构建模型进行分类
1.线性回归模型
划分数据,构建线性回归模型:
predictors = ["Pclass", "Sex", "Age", "SibSp", "Parch", "Fare", "Embarked"]  # 选用的特征
alg = LinearRegression()  # 线性回归模型
kf = KFold(n_splits=3, shuffle=False, random_state=1)  # K折交叉验证,把数据分成K份

predictions = []
for train, test in kf.split(titanic):
    # print("%s %s" % (train.shape, test.shape))
    # print("%s %s" % (train, test))  # 训练集、测试集的索引号
    train_predictors = (titanic[predictors].iloc[train, :])  # 提取训练集中的特征数据
    train_target = titanic["Survived"].iloc[train]  # 对应的标签
    alg.fit(train_predictors, train_target)  # 训练
    test_predictions = alg.predict(titanic[predictors].iloc[test, :])  # 预测
    predictions.append(test_predictions)  # 保存预测结果
计算准确率:
predictions = np.concatenate(predictions, axis=0)  # 将3次结果拼接起来
predictions[predictions > .5] = 1  # 转为成2分类问题,概率大于0.5就认为是1
predictions[predictions <=.5] = 0
accuracy = sum(predictions == titanic["Survived"]) / len(predictions)
print(accuracy)
预测准确率为:0.7833894500561167
2. 逻辑回归算法
alg = LogisticRegression(solver="liblinear")  # 创建预测模型
scores = cross_val_score(alg, titanic[predictors], titanic["Survived"], cv=3)  # 3折交叉验证训练
print("逻辑回归准确率:", scores.mean())
逻辑回归准确率: 0.7878787878787877
3.随机森林预测
alg = RandomForestClassifier(random_state=1, n_estimators=100, min_samples_split=4, min_samples_leaf=2)  # 100棵树
scores = cross_val_score(alg, titanic[predictors], titanic["Survived"], cv=3)
print("随机森林准确率:", scores.mean())
随机森林准确率: 0.8226711560044894
4.从原始数据中构建新特征
titanic["FamilySize"] = titanic["SibSp"] + titanic["Parch"]  # 计算家庭成员数量 兄弟姐妹数量+携带孩子
titanic["NameLength"] = titanic["Name"].apply(lambda x: len(x))  # 计算名字长度
提取名字里面包含称呼,如小姐,女士,先生等等,构造新特征
# 得到名字中的称呼,返回匹配的值
def get_title(name):
    title_search = re.search(' ([A-Za-z]+)\.', name)  # 使用正则表达式搜索,大小写字母 + .
    if title_search:
        return title_search.group(1)
    return ""

titles = titanic["Name"].apply(get_title)
print(pandas.value_counts(titles))  # 计算每个名称的数量
数据集每个名称的数量:
Mr 517
Miss 182
Mrs 125
Master 40
Dr 7
Rev 6
Major 2
Mlle 2
Col 2
Sir 1
Countess 1
Don 1
Jonkheer 1
Mme 1
Ms 1
Capt 1
Lady 1
Name: Name, dtype: int64
# 将每个标题映射到一个整数。有些标题非常罕见,并且被压缩到与其他标题相同的代码中
title_mapping = {"Mr": 1, "Miss": 2, "Mrs": 3, "Master": 4, "Dr": 5, "Rev": 6, "Major": 7, "Col": 7, "Mlle": 8,
                 "Mme": 8, "Don": 9, "Lady": 10, "Countess": 10, "Jonkheer": 10, "Sir": 9, "Capt": 7, "Ms": 2}
# 转为为对应的数字
for k, v in title_mapping.items():
    titles[titles == k] = v
# print(pandas.value_counts(titles))
# 添加一个特征列
titanic["Title"] = titles
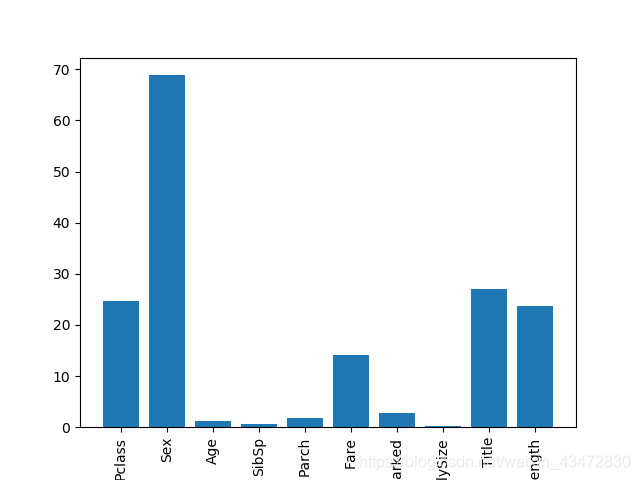
5.可视化特征比重:
# 构建新特征
predictors = ["Pclass", "Sex", "Age", "SibSp", "Parch", "Fare", "Embarked", "FamilySize", "Title", "NameLength"]

selector = SelectKBest(f_classif, k=10)  # 分类任务,选择前k个特征
selector.fit(titanic[predictors], titanic["Survived"])
scores = -np.log10(selector.pvalues_)  # 转化特征得分的p_value值

plt.bar(range(len(predictors)), scores)  # 条形图,x值,高度值
plt.xticks(range(len(predictors)), predictors, rotation='vertical')  # x轴,x值,名称
plt.show()

6.使用集成算法预测
algorithms = [
    [GradientBoostingClassifier(random_state=1, n_estimators=25, max_depth=3),
     ["Pclass", "Sex", "Age", "Fare", "Embarked", "FamilySize", "Title"]],
    [LogisticRegression(solver="liblinear"), ["Pclass", "Sex", "Fare", "FamilySize", "Title", "Age", "Embarked"]]
]  # 两种预测算法以及对应选择的特征

kf = KFold(3)
predictions = []
for train, test in kf.split(titanic):
    train_target = titanic["Survived"].iloc[train]
    full_test_predictions = []
    # 对每个折叠中的每个算法进行预测
    for alg, predictors in algorithms:
        alg.fit(titanic[predictors].iloc[train, :], train_target)
        test_predictions = alg.predict_proba(titanic[predictors].iloc[test, :].astype(float))[:, 1]  # 获取预测为1的概率
        full_test_predictions.append(test_predictions)
    test_predictions = (full_test_predictions[0] * 1 + full_test_predictions[1] * 1) / 2  # 两种预测概率取平均
    test_predictions[test_predictions <= .5] = 0
    test_predictions[test_predictions > .5] = 1
    predictions.append(test_predictions)

predictions = np.concatenate(predictions, axis=0)
accuracy = sum(predictions == titanic["Survived"]) / len(predictions)
print("两种方法平均准确率:", accuracy)
两种方法平均准确率: 0.8215488215488216
来源:CSDN
作者:王氏小明
链接:https://blog.csdn.net/weixin_43472830/article/details/103233740