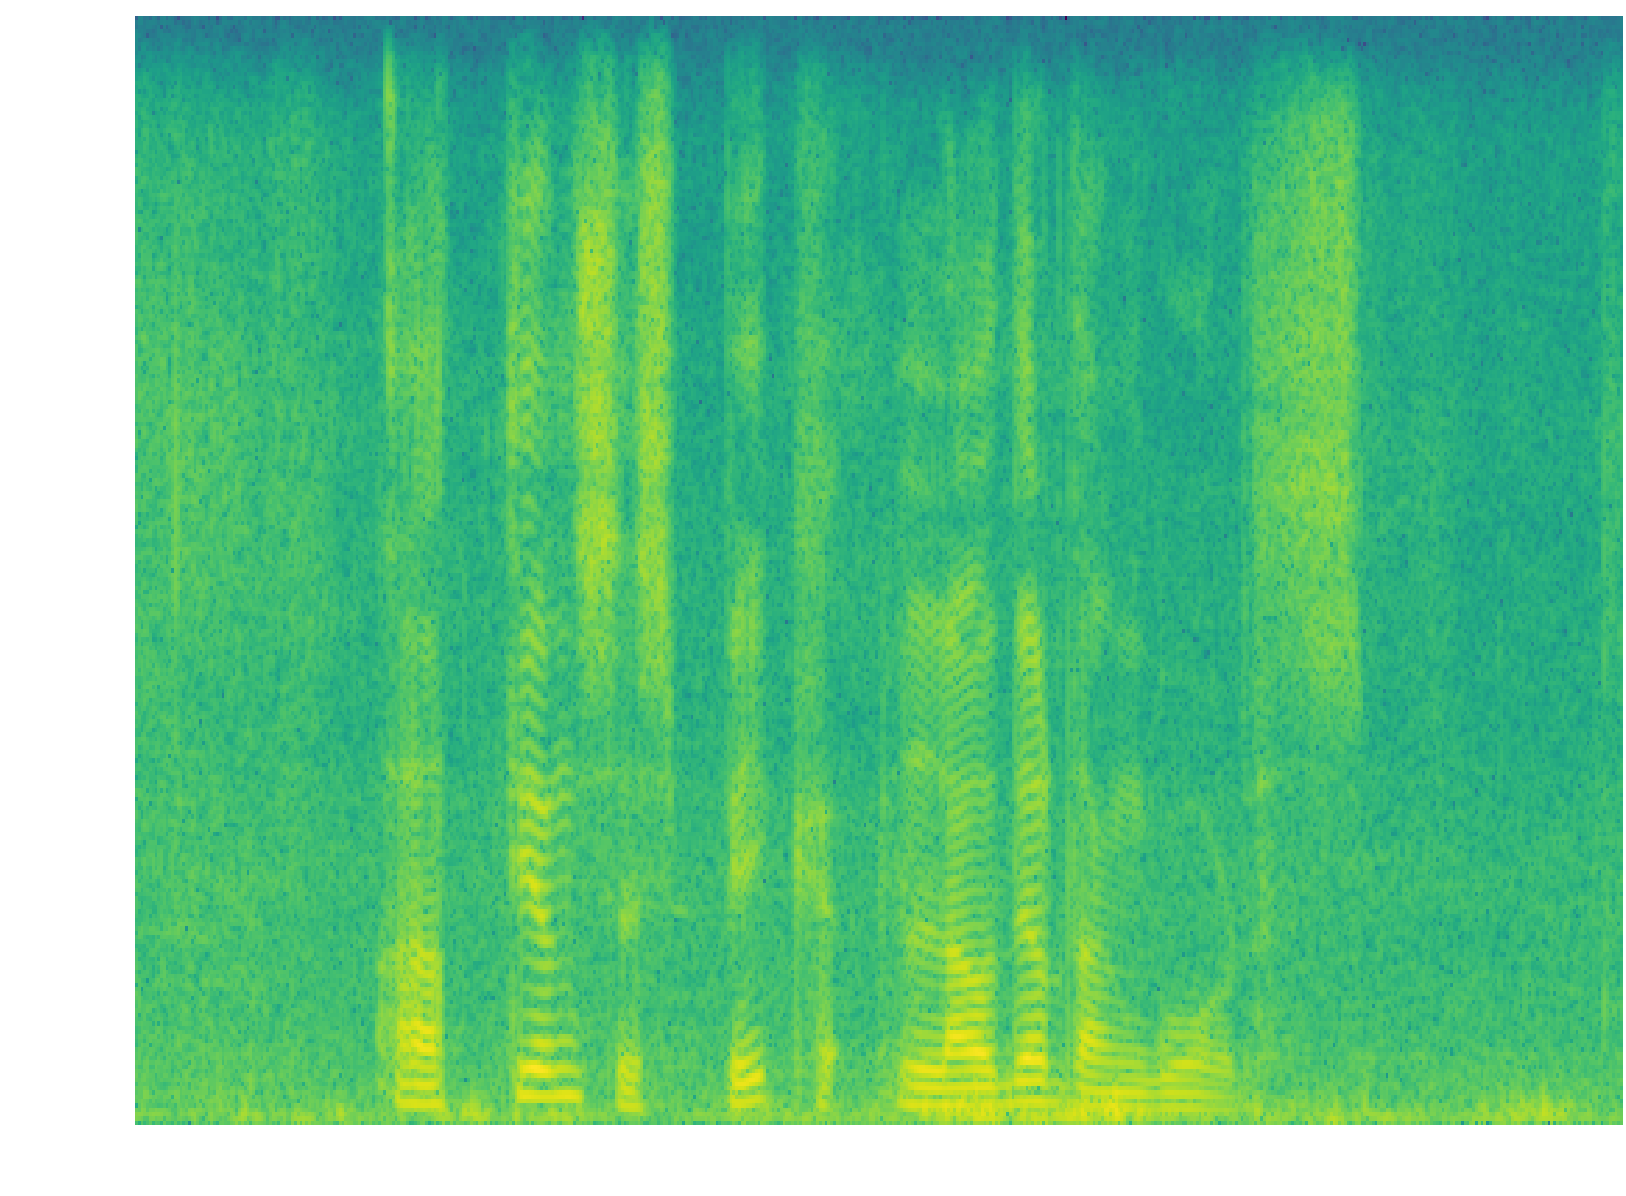
I'd like to obtain a spectrogram out of a wav file and then save it to a png, but I need just the content of the image (not axes or anything else). I came across these questions
Matplotlib plots: removing axis, legends and white spaces
scipy: savefig without frames, axes, only content
I've also read the Matplotlib documentation but it seems useless and so either answers to questions above are outdated or I'm doing something wrong because simple
plt.savefig('out.png', bbox_inches='tight', pad_inches=0)
does not do what I want to achieve. Initially I tried to follow this guide but the code crashes. Then I tried this approach, but since it's outdated I modified it a little:
import matplotlib.pyplot as plt
from scipy.io import wavfile
import numpy as np

def graph_spectrogram(wav_file):
    rate, data = wavfile.read(wav_file)
    pxx, freqs, bins, im = plt.specgram(x=data, Fs=rate, noverlap=384, NFFT=512)
    plt.axis('off')
    plt.savefig('sp_xyz.png', bbox_inches='tight', dpi=300, frameon='false')

if __name__ == '__main__': # Main function
    graph_spectrogram('...')
This is what I got: Maybe it's not visible, but there's a white border around the content (from the biggest to the smallest): left, bottom, top, right. I want the same image but just the content without anything else. How can I achieve that? I use python 3.6 and Matplotlib 2.0.2.
I think you want subplots_adjust:
fig,ax = plt.subplots(1)
fig.subplots_adjust(left=0,right=1,bottom=0,top=1)
ax.axis('tight')
ax.axis('off')
In this case:
import matplotlib.pyplot as plt
from scipy.io import wavfile
import numpy as np

def graph_spectrogram(wav_file):
    rate, data = wavfile.read(wav_file)
    fig,ax = plt.subplots(1)
    fig.subplots_adjust(left=0,right=1,bottom=0,top=1)
    ax.axis('off')
    pxx, freqs, bins, im = ax.specgram(x=data, Fs=rate, noverlap=384, NFFT=512)
    ax.axis('off')
    fig.savefig('sp_xyz.png', dpi=300, frameon='false')

if __name__ == '__main__': # Main function
    graph_spectrogram('...')
May be helpful for someone who use librosa latest versions.
You can add transparent=True to the plt.savefig() function to set transparent background. But the problem is still x and y axis information are visible. Hens, you need to remove axis details using ax.set_axis_off()
You can remove right side color-bar by commenting out plt.colorbar()
plt.figure(figsize=(12, 4))
ax = plt.axes()
ax.set_axis_off()
plt.set_cmap('hot')
librosa.display.specshow(librosa.amplitude_to_db(S_full[:, idx], ref=np.max), y_axis='log', x_axis='time',sr=sr)
plt.colorbar()
plt.savefig(f'{args["output"]}/{name}_{i}.png', bbox_inches='tight', transparent=True, pad_inches=0.0 )
Please click images to check differences
When nothing is changed(Default)

When the axis informations are off Using ax.set_axis_off()
Here, this image doesn't have axis info but white background is there.

When enabling transparent using transparent= True
Here, this image doesn't have white background but axis info is there.

With axis info are off and enabling transparent
This image doesn't have either white background or axis info

You may not see the exact differences since images might be changed when uploading.
来源:https://stackoverflow.com/questions/47147146/save-an-image-only-content-without-axes-or-anything-else-to-a-file-using-matl