Estimating skewness of histogram in MATLAB
What test can I do in MATLAB to test the spread of a histogram? For example, in the given set of histograms, I am only interested in 1,2,3,5 and 7 (going from left to right,
-
You can use the standard definition of skewness. In other words, you can use:

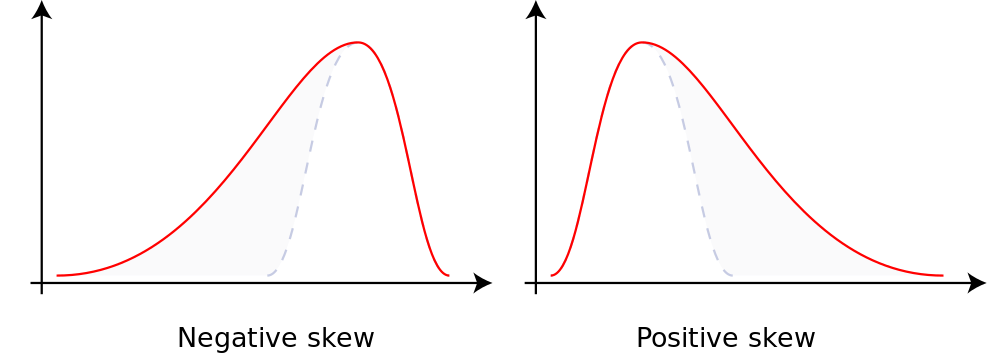
You compute the mean of your data and you use the above equation to calculate skewness. Positive and negative skewness are like so:
 Source: Wikipedia
As such, the larger the value, the more positively skewed it is. The more negative the value, the more negatively skewed it is.
Now to compute the mean of your histogram data, it's quite simple. You simply do a weighted sum of the histogram entries and divide by the total number of entries. Given that your histogram is stored in
h, the bin centres of your histogram are stored inx, you would do the following. What I will do here is assume that you have bins from 0 up toN-1whereNis the total number of bins in the histogram... judging from your picture:x = 0:numel(h)-1; %// Judging from your pictures num_entries = sum(h(:)); mu = sum(h.*x) / num_entries; skew = ((1/num_entries)*(sum((h.*x - mu).^3))) / ... ((1/(num_entries-1))*(sum((h.*x - mu).^2)))^(3/2);skewwould contain the numerical measure of skewness for a histogram that follows that formula. Therefore, with your problem statement, you will want to look for skewness numbers that are positive and large. I can't really comment on what threshold you should look at, but look for positive numbers that are much larger than most of the histograms that you have.讨论(0)
- 热议问题

 加载中...