How do I plot lines between all points in a vector?
I have a vector containing some points in 2-D space. I want MATLAB to plot these points with lines drawn from every point to every other point. Basically, I want a graph with al
-
One solution is to create a set of indices for every combination of points using the function MESHGRID. You can then plot each line using the function LINE (which plots one line per column of data it's given):
N = 10;                               %# Number of points
x = rand(1,N);                        %# A set of random x values
y = rand(1,N);                        %# A set of random y values
[I,J] = meshgrid(1:N);                %# Create all the combinations of indices
index = [I(:) J(:)].';               %'# Reshape the indices
line(x(index),y(index),'Color','k');  %# Plot the lines
hold on
plot(x,y,'r*');                       %# Plot the points
EDIT:
You may notice that the above solution will plot a line for every connection, meaning that it will plot lines of zero length connecting points to themselves and will plot 2 lines for every connection (i.e. from point A to point B and from point B to point A). Here's another solution (using the functions HANKEL and FIND) that won't plot the redundant or unnecessary lines:
N = 10;                               %# Number of points
x = rand(1,N);                        %# A set of random x values
y = rand(1,N);                        %# A set of random y values
[r,c,v] = find(hankel(2:N));          %# Create unique combinations of indices
index = [v c].';                     %'# Reshape the indices
line(x(index),y(index),'Color','k');  %# Plot the lines
hold on
plot(x,y,'r*');                       %# Plot the points
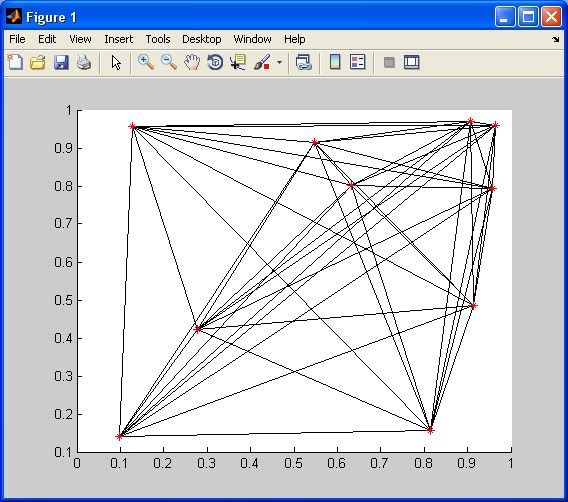
Both of the above solutions create visually identical plots:

A note on timing...
Out of curiosity, I thought I'd time my HANKEL solution and compare it with Amro's very terse NCHOOSEK solution. For
N = 10, there was no appreciable difference. However, as I increasedNto much larger values I began to see the NCHOOSEK solution start to become very slow:N = 200
>> tic; [r,c,v] = find(hankel(2:N)); index = [v c].'; toc; %'
Elapsed time is 0.009747 seconds.

>> tic; pairs = nchoosek(1:N,2).'; toc; %'
Elapsed time is 0.063982 seconds.
N = 1000
>> tic; [r,c,v] = find(hankel(2:N)); index = [v c].'; toc; %'
Elapsed time is 0.175601 seconds.

>> tic; pairs = nchoosek(1:N,2).'; toc; %'
Elapsed time is 12.523955 seconds.
I was kind of surprised, until I looked at the code for NCHOOSEK (by typing
type nchoosekin the MATLAB command window). Not only is a variable being grown inside a loop instead of being preallocated (as Amro pointed out in a comment), but the algorithm used is also recursive, meaning that many function calls are made. I also noticed this line at the end of the help text for NCHOOSEK:This syntax is only practical for situations where N is less than about 15.
- 热议问题

 加载中...